Distributive Analysis of Government Tax and Welfare Measures, 2020-2025

Budget 2025 marked the fifth and final Budget of the coalition Government that held office from 2020-2025. The first two of these were presented in the context of the challenging Covid-19 pandemic (Budget 2021 in October 2020, Budget 2022 in October 2021) while the third and fourth were presented during the cost-of-living crisis (Budget 2023 in September 2022, Budget 2024 in October 2023) and the fifth at the end of that crisis period (Budget 2025 in October 2024). In this analysis, we track the cumulative impact of changes to income taxation and welfare over that Government’s five Budgets – we do so by comparing the disposable income of households in 2025 with their disposable income when the Government took office in 2020. As different policy priorities can be articulated for each Budget and policy initiative, it is useful to bring together the cumulative effect of all these policy changes on various household types.
Distributive Analysis of Government Tax and Welfare Measures, 2020-2025
This analysis captures changes to the value of core welfare payments and changes to tax credits, tax bands and PRSI rates announced in those five Budgets; policy measures we have referred to earlier as ‘permanent measures’. As the analysis is intended to highlight the underlying distributive picture of recent Government policy we have not included the various temporary income support measures which were also part of these Budgets. The households we examine are the same as those included in Table 1 and are spread across all areas of society capturing those with a job, families with children, those who are unemployed and pensioner households.
At the outset it is important to stress that our analysis does not take account of some other budgetary changes, most particularly to indirect taxes (VAT and excise), other charges (such as prescription charges and state exam fees) and property taxes. Similarly, it does not capture the impact of changes to the provision of public services or the many emergency measures that were introduced to respond to the Covid-19 emergency. As the impact of these measures differs between households it is impossible to quantify precise household impacts and include them here. Also, it does not include changes in earnings although CSO data indicate that these have been significant over the past three to four years reflecting shortages of labour, inflation pressures and public-sector pay agreements.
Comparing 2020 to 2025 for households with jobs (see chart 1), the weekly income gains experienced range from €3.34 per week (for low-income couples on €30,000) to €110-120 per week for couples with incomes over €100,000. The analysis highlights the gaps that recent Budget policy has opened up among working households; divides visible in this analysis but missing in much of the Budgetary commentary which did not distinguish between the transitory temporary measures and the tax and welfare changes that will persist. For example, comparing a couple with two earners on €60,000 to a couple with two earners on €100,000, the five budgets have delivered €39.32 more per week to the higher income household; opening up a gap between these households of €2,050 per annum. The analysis also demonstrates how low-income working families, those with incomes below the standard rate income tax threshold, have gained least from the Government’s measures over the past five years.
Chart 1: Cumulative Tax and Benefit Increase in Weekly Income for Households with Jobs, 2020-2025
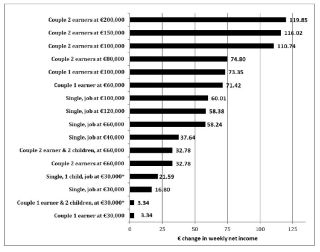
Source: Social Justice Ireland Income Distribution Model. Notes: *Depending on circumstances, these household may also be entitled to the Working Family Payment. Couple one earner is assumed to receive the Home Carer Tax Credit.
Chart 2: Cumulative Tax and Benefit Increase in Weekly Income for Welfare Dependent Households, 2020-2025
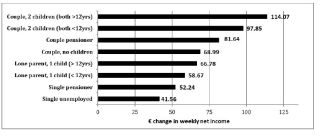
Source: Social Justice Ireland Income Distribution Model.
Among households dependent on welfare (see chart 2), the gains have ranged from €42 per week for single unemployed individuals to €114 per week for unemployed couples with 2 children over 12 years of age. The gains are largest for welfare dependent household with children who benefited from a series of very welcome increases to the weekly qualified child allowance over the period; for children under 12 this has increased from €36 in 2020 to €50 in 2025 and for children over 12 the increase was from €40 to €62.
By looking at permanent (rather than once-off temporary) changes to income taxation and welfare rates our analysis provides a clearer picture of the distributive record of budgetary policy over the period of office of the last Government (2020-2025). Despite welcome welfare increases, particularly for families with children, it is the highest earners who have gained most over the five budgets. The deterioration in the relative standing of low and middle income households presents a troubling picture, one that will reveal itself further in the official income distribution data from the CSO for 2025 and 2026 onwards. Social Justice Ireland regrets that much of the recent progress on income distribution and inequality will have been reversed by these policy choices. Looking ahead, reversing these increased income gaps will pose important challenges for future budgetary policy.