A Limited Perspective: Gaps in the Government's 2024 Wellbeing Framework

The evaluation of wellbeing as a measure of societal progress is gaining ground internationally, reflecting a positive shift away from the narrower focus of traditional economic measures like GDP to a more comprehensive understanding that includes social and environmental aspects. In line with this shift, the Government of Ireland introduced itsWellbeing Frameworkto guide policies aimed at improving quality of life. While this initiative is welcome, Social Justice Ireland’s assessment reveals significant gaps in the Government’s current approach, particularly concerning equality and sustainability.
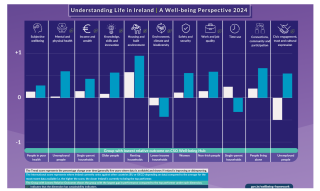
The Government’s report,Understanding Life in Ireland: The Well-being Framework 2024 (Figure 1),presents a broadly positive picture of progress, largely due to a shift in the measurement as well as choice of indicators. Unlike the previous iteration, explicit assessments of equality and sustainability have been removed from core performance metrics and confined to narrative sections. TheGovernment’s 2023 Wellbeing Frameworkoffered a more nuanced and transparent measurement of wellbeing. While its multidimensional nature may have increased complexity, it provided a comprehensive assessment that policymakers, researchers, and stakeholders could use to inform decision-making. However, the 2024 Wellbeing Framework, in contrast, moved towards a simplified methodology and unfortunately missed an opportunity of building on this strong foundation. Equality is now only referenced in the narrative sections rather than being integrated into core progress metrics. Without explicit measurement, disparities between different groups are less visible, similarly, while a number of indicators are still tagged for sustainability, the methodology in 2024 has no mechanism to assess whether the overall performance of a dimension is progressive or regressive with regards to sustainability.
Recalculating Wellbeing: Measuring 2024 Indicators with the 2023 Approach
To provide a fuller and more accurate assessment of Ireland’s wellbeing, we have recalculated the Government’s 2024 Wellbeing Framework using the Government’s own 2023 methodology. This approach restores equality and sustainability as core metrics, ensuring that progress is not only measured in aggregate terms but also evaluated in terms of how equitably it is distributed and whether it can be sustained over time. Our recalculations reveal that while nine out of eleven dimensions show some positive progress – largely due to the choice of indicators – persistent inequalities remain across all dimensions (Figure 2).
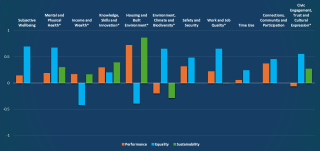
Note: This version applies the Government’s more robust 2023 methodology to the data presented in the 2024 report.
(*) indicates the dimensions that have sustainability indicators
Equality scores[1]highlight disparities that are not immediately visible in the Government’s 2024 framework. Four dimensions show lower inequality relative to others (scoring above +0.5), this still reflects substantial gap between the best- and worst-performing groups. Whereas, three dimensions reveal high inequality, and two – Income and Wealth and Housing and the Built Environment – show a deepening divide, with negative scores.
Sustainability, too, remains an area of concern. With the exception of Housing and the Built Environment (where indicator selections skew results), all sustainability-tagged indicators show only marginal or negative progress (Figure 2). This raises serious questions about the long-term viability of current trends and whether Ireland’s wellbeing gains can be maintained in the future.
These recalculations present a notably different picture of Ireland’s wellbeing than the Government’s 2024 report. While the Government’s report shows strong performance in Housing and Built Environment dimension, it is largely due to increases in energy-efficient homes and new dwelling completions in the last decade, the recalculated equality score exposes a troubling reality. Low-income families and renters continue to face significant barriers to housing access, a disparity that is obscured in the Government’s 2024 framework’s focus on aggregate performance.
Similarly, in the Income and Wealth dimension, although the Government’s 2024 report shows slight overall improvements, the recalculated metrics highlight persistent financial disparities. For budgeting and policymaking, these disparities should not be overlooked. The equality score of -0.4 suggests that the gains in income and wealth are not being distributed equitably across society. Vulnerable groups – such as low-income households, those unable to work due to long-standing health conditions, the unemployed, and renters – are being left behind. While the report acknowledges these issues in its narrative, they are absent from the core performance scores, presenting a positive view of progress.
The same critique applies to other dimensions. In Work and Job Quality, the Government’s 2024 report celebrates full employment, and while this reflects massive improvements, the recalculated sustainability score reveals a different story. Despite the positive employment figures, there has been little to no progress in ensuring the sustainability of this growth, indicating that while short-term job creation is strong, there may be long-term concerns about job stability, quality, and future resilience.
By removing equality and sustainability from the core metrics, the Government’s 2024 framework provides a simplified but incomplete picture of national wellbeing. While the report focuses on overall progress, it fails to address the deeper questions of who benefits and whether the improvements will last.
To read the full analysis check our report Wellbeing: Measuring What Matters - An Alternative Framework for a Fairer Future.
[1] A score of +1 reflects full equality, while 0 indicates a 100 per cent disparity between the best- and worst-performing groups, and a negative score represents a 200 per cent disparity (a negative score arises if the relative percentage difference exceeds 100 per cent). See the report for greater detail.