Poverty in Ireland

Despite progress on the issue over the past two decades, there is still considerable poverty in Ireland. Driven by increases in social welfare payments, particularly payments to the unemployed, the elderly and people with disabilities, the rate of poverty declined between 2001 and 2009. [1] Subsequently, welfare rates were reduced and poverty increased during the economic crash. In recent years, driven once again by welfare increases, poverty has fallen and now stands at 13.1 per cent of the population according to the latest data, which is for 2022.
Data on Ireland’s income and poverty levels are provided by the annual SILC, or Survey on Income and Living Conditions. This survey replaced the European Household Panel Survey and the Living in Ireland Survey which had run throughout the 1990s. Since 2003 the SILC / EU-SILC survey has collected detailed information on income and living conditions from up to 100 households in Ireland each week; giving a sample of 4,000 to 6,000 annually.
Social Justice Ireland welcomes this survey and in particular the accessibility of the data produced. Because this survey is conducted simultaneously across all European Union (EU) states, the results are an important contribution to the ongoing discussions on income and poverty levels across the EU. It also provides the basis for informed analysis of the relative position of the citizens of member states. In particular, this analysis is informed by a set of agreed indicators of social exclusion covering four dimensions of social exclusion: financial poverty, employment, health, and education. They also form the basis of the EU Open Method of Co-ordination for social protection and social inclusion and associated poverty and social exclusion targets.
What is poverty?
The National Anti-Poverty Strategy (NAPS) published by Government in 1997 adopted the following definition of poverty:
People are living in poverty if their income and resources (material, cultural and social) are so inadequate as to preclude them from having a standard of living that is regarded as acceptable by Irish society generally. As a result of inadequate income and resources people may be excluded and marginalised from participating in activities that are considered the norm for other people in society.
This definition was reiterated in the subsequent National Action Plan for Social Inclusion 2007-2016 and restated in the current Roadmap for Social Inclusion 2020-2025.
Where is the poverty line?
How many people are poor? On what basis are they classified as poor? These and related questions are constantly asked when poverty is discussed or analysed.
In trying to measure the extent of poverty, the most common approach has been to identify a poverty line (or lines) based on people’s disposable income (earned income after taxes and including all benefits). The European Commission and the United Nations (UN), among others, use a poverty line located at 60 per cent of median income. The median disposable income is the income of the middle person in society. This poverty line is the one adopted in the SILC survey. While the 60 per cent median income line has been adopted as the primary poverty line, alternatives set at 50 per cent and 70 per cent of median income are also used to clarify and lend robustness to assessments of poverty.
The most up-to-date data available on poverty in Ireland comes from the 2022 SILC survey, conducted by the CSO and published in February 2023. In that year the CSO gathered data from a statistically representative sample of 4,660 households containing 11,393 individuals. The data gathered by the CSO is very detailed and incorporates income from work, welfare, pensions, rental income, dividends, capital gains and other regular transfers. Where possible, this data was subsequently verified anonymously using PPS numbers.
When gathering income data, the SILC survey uses income from the year before the survey as the ‘income reference period’. Therefore, the data published in the 2022 report refers to income levels in 2021. According to the CSO, the median disposable income per adult in Ireland during 2021 was €26,257 per annum or €503.20 per week. Consequently, the income poverty lines for a single adult derived from this are:
50% of median | €251.60 a week |
60% of median | €301.92 a week |
70% of median | €352.24 a week |
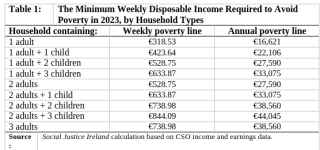
Updating the 60 per cent median income poverty line to 2023 levels, using published CSO data on the growth in average hourly earnings in 2022 (+5.5 per cent), produces a value for the relative income poverty line at the start of that year. In 2023 that figure is €318.53 for a single person. Any adult below this weekly income level will be counted as being at risk of poverty.
Table 1 shows what income corresponds to this poverty line for a number of household types. The figure of €318.53 is an income per adult equivalent figure. It is the minimum weekly disposable income (after taxes and including all benefits) that one adult needs to be above the poverty line. For each additional adult in the household this minimum income figure is increased by €210.23 (66 per cent of the poverty line figure) and for each child in the household the minimum income figure is increased by €105.11 (33 per cent of the poverty line).[2] These adjustments reflect the fact that as households increase in size they require more income to meet the basic standard of living implied by the poverty line. In all cases a household below the corresponding weekly disposable income figure is classified as living at risk of poverty. For clarity, corresponding annual figures are also included.
One immediate implication of this analysis is that most weekly social assistance rates paid to single people are €98 below the poverty line.

How many have incomes below the poverty line?
Table 2 outlines the findings of various poverty studies since detailed national poverty assessments commenced in 1994. Using the EU poverty line set at 60 per cent of median income, the findings reveal that almost 13 out of every 100 people in Ireland were living in poverty in 2022. The table shows that over time poverty rates have fluctuated. In general, decreases have occurred in periods where national budgets have given greater attention to improving minimum welfare payments or prioritising welfare dependent households. Conversely, poverty has increased in periods where welfare payments were less of a policy priority and therefore gaps opened between those benefiting from tax and earnings changes and those households dependent on support from the social transfer system.

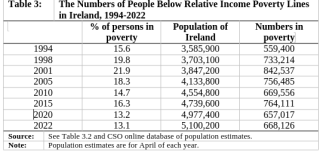
Because it is sometimes easy to overlook the scale of Ireland’s poverty problem, it is useful to translate these poverty percentages into numbers of people. Using the percentages for the 60 per cent median income poverty line and population statistics from CSO population estimates, we can calculate the numbers of people in Ireland who have been in poverty for a number of years between 1994 and 2022. These calculations are presented in table 3. The results give a better picture of just how significant this problem is.

The table’s figures are telling. Looking over the past 28 years, despite a reduction in the headline poverty rate (from 15.6 per cent to 13.1 per cent) there are almost 110,000 more people in poverty. Notably, over the period from 2004-2008, the period corresponding with consistent Budget increases in minimum social welfare payments, almost 145,000 people left poverty. This progress was reversed by the subsequent recession, and the rate and number in poverty began to fall from 2016 onwards driven by various budgetary policies that prioritised lower income households and welfare. The latest figures suggest that the numbers in poverty today are similar to those of just over a decade ago.
The fact that there are almost 670,000 people in Ireland living life on a level of income that is this low remains a major concern. As shown in table 1 these levels of income are low and those below them clearly face difficulties in achieving what the NAPS described as “a standard of living that is regarded as acceptable by Irish society generally”.
Maintaining an Adequate Level of Social Welfare
A lesson from past experiences of economic recovery and growth is that the weakest in our society get left behind unless welfare increases keep track with increases elsewhere in the economy. Consequently, Social Justice Ireland believes that benchmarking minimum rates of social welfare payments to movements in average earnings is therefore an important policy priority.
Over 15 years ago, Budget 2007 benchmarked the minimum social welfare rate at 30 per cent of Gross Average Industrial Earnings (GAIE). This was a key achievement and one that we correctly predicted would lead to reductions in poverty rates, complementing those already achieved and detailed earlier. Since then, the CSO discontinued its Industrial Earnings and Hours Worked dataset and replaced it with a more comprehensive set of income statistics for a broader set of Irish employment sectors. A subsequent report for Social Justice Ireland found that 30 per cent of GAIE is equivalent to 27.5 per cent of the new average earnings data being collected by the CSO. [3] A figure of 27.5 per cent of average earnings is therefore the appropriate benchmark for minimum social welfare payments and reflects a continuation of the previous benchmark using the current CSO earnings dataset.
Table 4 applies this benchmark using the latest CSO Earnings and Labour Costs data. By the end of 2022 average weekly earnings equalled €881.29. Taking this as the starting point for earnings in 2023, we can determine that the updated value of 27.5 per cent of average weekly earnings equals €242.35 implying a shortfall of almost €22.35 between the minimum social welfare rates being paid in 2023 (€220) and this threshold.
Given the importance of this benchmark to the living standards of many in Irish society, and its relevance to anti-poverty commitments, the current deficit highlights a need for the Government, and Budget 2024, to further increase minimum social welfare rates and commit to converging on a benchmark equivalent to 27.5 per cent of average weekly earnings. We will further update the calculations as part of our pre-Budget submission, Budget Choices, in mid-2023.

[1] Irish household income data has been collected since 1973 and all surveys up to the period 2008-2010 recorded poverty levels above 15 per cent.
[2] For example, the poverty line for a household with 2 adults and 1 child would be calculated as €318.53 + €210.23 + €105.11 = €633.87.
[3] Collins, M.L. (2011) Establishing a Benchmark for Ireland’s Social Welfare Payments. Paper for Social Justice Ireland. Dublin: Social Justice Ireland.