Taxation Outcomes and Reform

Ireland is a low tax country with ever-increasing demands on resources. We saw during the pandemic the impact of under-investment in housing, healthcare, education, childcare, and recreational amenities. This under-investment is further being highlighted by the influx of refugees fleeing Ukraine. Investment costs money, both in capital expenditure in long-term areas such as housing and other physical infrastructure; and in current expenditure to staff our schools and hospitals and manage our social housing stock.
In this article we outline the background data on taxation in Ireland. The article is split into section on ‘Taxation Outcomes’ and ‘Taxation Reform’. Under Outcomes, we first compare the overall level of taxation in Ireland to that of other European countries and then trace how this has changed over time. We then examine trends in income tax levels, outline and compare income tax levels across the income distribution, and examine the distribution of indirect taxes on households.
As part of the issue of taxation Reform, the material reviews the issue of taxation and competitiveness before summarising some of the evidence support progressive taxation changes related to a financial transactions tax (FTT) and refundable tax credits.
Ireland’s total tax-take up to 2020
The most recent comparative data on the size of Ireland’s total tax-take has been produced by Eurostat and is detailed alongside that of 26 other EU states in table 1. The definition of taxation employed by Eurostat comprises all compulsory payments to central government (direct and indirect) alongside social security contributions (employee and employer) and the tax receipts of local authorities.[1] The tax-take of each country is established by calculating the ratio of total taxation revenue to national income as measured by gross domestic product (GDP). Table 1 also compares the tax-take of all EU member states against the average EU-27 tax-take of 37.5 per cent.
Table 1: | Total Tax Revenue as a % of GDP for EU-27 Countries, 2020 | ||||||
Country | % of GDP | +/- from average | Country | % of GDP | +/- from average | ||
Denmark | 47.6 | +10.1 | Poland | 36.6 | -0.9 | ||
France | 47.5 | +10.0 | Hungary | 36.4 | -1.1 | ||
Belgium | 46.2 | +8.7 | Czechia | 36.1 | -1.4 | ||
Sweden | 43.7 | +6.2 | Slovakia | 35.2 | -2.3 | ||
Italy | 43.0 | +5.5 | Cyprus | 34.6 | -2.9 | ||
Austria | 42.6 | +5.1 | Estonia | 34.4 | -3.1 | ||
Finland | 42.3 | +4.8 | Latvia | 32.0 | -5.5 | ||
Germany | 41.5 | +4.0 | Lithuania | 31.2 | -6.3 | ||
Greece | 41.3 | +3.8 | Bulgaria | 30.6 | -6.9 | ||
Netherlands | 40.2 | +2.7 | Malta | 30.4 | -7.1 | ||
Luxembourg | 39.8 | +2.3 | Ireland GNDI | 27.6 | -9.9 | ||
Slovenia | 37.9 | +0.4 | Ireland GNP | 27.3 | -10.2 | ||
Portugal | 37.6 | +0.1 | Romania | 27.2 | -10.3 | ||
Spain | 37.5 | 0.0 | Ireland GDP | 20.7 | -16.8 | ||
Croatia | 37.3 | -0.2 | EU-27 average | 37.5 |
| ||
Source: | Eurostat online database and CSO online database: National Income and Expenditure Accounts (as per Table 4.1). | ||||||
Notes: | EU-27 average is the arithmetic mean. As Ireland’s figures have been skewed by large multinational effects in national accounts and taxation income we use three national income measures. | ||||||
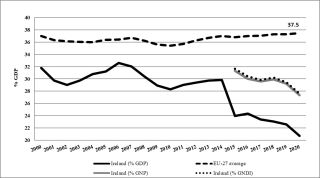
Of the EU-27 states, the highest tax ratios can be found in Denmark, France, Belgium, Sweden and Italy while the lowest appear in Romania, Malta, Bulgaria, Lithuania, Latvia and Ireland. The effect of multinational company restructuring on Ireland’s national accounts in 2015, and subsequent tax short-term corporate tax revenue increases, impacts on the data by inflating the GDP (and GNP) figure. Prior to this effect, Ireland’s tax to GDP ratio stood at 30.5 per cent; some way below the EU average.
Ireland’s overall tax take has remained notably below the EU average over recent years (see chart A4.1). The increase in the overall level of taxation between 2002 and 2006 can be explained by short-term increases in construction-related taxation sources (in particular stamp duty and construction related VAT) rather than any underlying structural increase in taxation levels.
Chart 1: Trends in Ireland and EU-27 Overall Taxation Levels, 2000-2020
Source: | Calculated using data from Eurostat and CSO online databases. For Ireland figures, see Table 1. |
In the context of the figures in table 1, and the trends in chart 1, the question needs to be asked: if we expect our economic and social infrastructure to catch up to that in the rest of Europe, how can we do this while simultaneously gathering less taxation income than it takes to run the infrastructure already in place in most of those other European countries? In reality, we will never bridge the social and economic infrastructure gaps unless we gather a larger share of our national income and invest it in building a fairer and more successful Ireland.
Effective income tax rates
It is also possible to focus on the changes to the levels of income taxation in Ireland over most of the last two decades. Central to any understanding of these personal/income taxation trends are effective tax rates. These rates are calculated by comparing the total amount of income tax a person pays with their pre-tax income. For example, a person earning €50,000 who pays a total of €10,000 in tax, PRSI and USC will have an effective tax rate of 20 per cent. Calculating the scale of income taxation in this way provides a more accurate reflection of the scale of income taxation faced by earners.
Following Budget 2022 we have calculated effective tax rates for a single person, a single income couple and a couple where both are earners. Table 2 presents the results of this analysis. For comparative purposes, it also presents the effective tax rates which existed for people with the same income levels ten and twenty years earlier.
In 2022, for a single person with an income of €15,000 the effective tax rate will be 0.8 per cent, rising to 12 per cent on an income of €25,000 and 40.4 per cent on an income of €120,000. A single income couple pay 0.8% at an income of €15,000. This increases to 5.6 per cent at an income of €25,000, 20.9 per cent at an income of €60,000, and 36.1 per cent at an income of €120,000. In the case of a couple, both earning and with a combined income of €40,000, their effective tax rate is 7 per cent, rising to 29.6 per cent for combined earnings of €120,000.
Table 2: | Effective Tax Rates following Budgets 2002 / 2012 / 2022 | ||||||||||
Income | Single Person | Couple 1 earner | Couple 2 Earners | ||||||||
| 2002 | 2012 | 2022 | 2002 | 2012 | 2022 | 2002 | 2012 | 2022 | ||
€15,000 | 7.7% | 2.7% | 0.8% | 2.2% | 2.7% | 0.8% | 0.0% | 2.0% | 0.0% | ||
€20,000 | 13.8% | 9.8% | 6.4% | 4.7% | 6.3% | 3.4% | 0.0% | 2.3% | 0.0% | ||
€25,000 | 16.2% | 14.0% | 12.0% | 7.1% | 7.2% | 5.6% | 4.1% | 2.5% | 0.6% | ||
€30,000 | 19.3% | 16.8% | 14.8% | 10.2% | 8.6% | 6.1% | 8.5% | 4.7% | 1.9% | ||
€40,000 | 26.4% | 24.2% | 19.8% | 15.7% | 14.2% | 10.0% | 12.3% | 9.2% | 7.0% | ||
€60,000 | 32.4% | 33.4% | 29.4% | 25.3% | 26.2% | 20.9% | 19.3% | 16.8% | 14.5% | ||
€100,000 | 37.1% | 40.9% | 38.1% | 32.8% | 36.5% | 33.0% | 29.9% | 29.7% | 25.6% | ||
€120,000 | 38.3% | 42.7% | 40.4% | 34.7% | 39.1% | 36.1% | 32.4% | 33.4% | 29.6% | ||
Source: | Social Justice Ireland (2021:6). | ||||||||||
Notes: | Data calculated as the total of income tax, levies/USC and PRSI as a % of total income. | ||||||||||
| Couples assume 2 children and 65%/35% income division. All workers are assumed to be PAYE earners. | ||||||||||
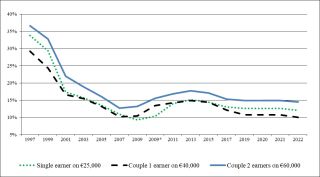
Although these rates did rise in the 2008-2010 period of economic crisis (see Chart 2) the overall trends is one of dramatic reductions with rates being low today compared to those that prevailed in 2002. Few people complained at that time about income tax levels being excessive and the recent increases should be seen in this context. Taking a longer view, chart A4.2 illustrates the downward trend in effective tax rates for three selected household types since 1997. These are a single earner on €25,000; a couple with one earner on €40,000; and a couple with two earners on €60,000. Their experiences are similar to those on other income levels and are similar to the effective tax rates of the self-employed over that period.
The two 2009 Budgets produced notable increases in these effective taxation rates. Both Budgets required government to raise additional revenue and with some urgency - increases in income taxes providing the easiest option. Similarly, the introduction of the USC in Budget 2011 increased these rates, most notably for lower income earners. The subsequent Budget 2012 provided a welcome reduction for the lowest earners through raising the income level at which the USC applies. Despite that change, the employee PRSI increase in Budget 2013 targeted lowest income earners hardest and increased effective taxation rate for almost all workers. Budget 2015 further raised the USC entry point and Budget’s 2016-2019 decreased most USC rates, having the effect of further decreasing the effective income tax rates faced by all taxpayers. However, income taxation is not the only form of taxation and, as we highlight in Chapter 4 of our Socioeconomic Review, there are many in Ireland with potential to contribute further taxation revenues.
Chart 2: Effective Tax rates in Ireland, 1997-2022
Source: | Department of Finance (2021) and Social Justice Ireland (2021:6). |
Notes: | See notes to Table A4.2. 2009*= Supplementary Budget 2009 (April 2009). |
Income tax changes 2014-2022
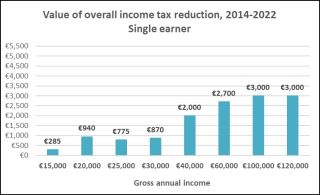
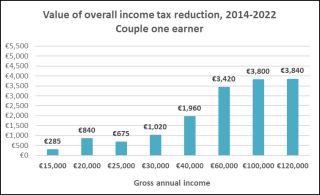
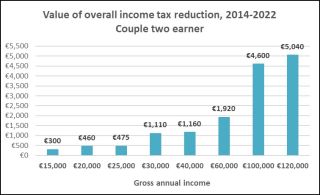
Following Budget 2022 (October 2021) Social Justice Ireland examined who gained from the recurring income tax decreases provided over most Budgets since 2014. We provide the results of that analysis here. Over three diagrams we compare the total annual value of these reductions between 2014 and 2022. The analysis captures changes to income tax rates, USC rates, social insurance rates and structures, and income tax credits. For example, a single earner with a gross income of €40,000 paid €9,920 in income taxes, employee PRSI and USC in 2014 and paid €7,920 in 2022; a reduction of €2,000 per annum.
The analysis highlights a number of points. First, it provides evidence of the scale of the income tax reductions delivered over recent years; these are often overlooked, yet are substantial at the individual/household level and at the exchequer level. Second, the charts illustrate the distribution of these income tax decreases. As we have highlighted in our annual budget documents the gains have been skewed to higher income earners and households.
Chart 3: Value of Overall income tax reduction, 2014-2022 - Single Earner
Source: Department of Finance Budget Documents - various years.
Notes: PAYE workers. For couples with 2 earners the income is assumed to be split 65%/35%.
Chart 4: Value of Overall Income Tax Reduction, 2014-2022 - Couple One Earner
Source: Department of Finance Budget Documents - various years.
Notes: PAYE workers. For couples with 2 earners the income is assumed to be split 65%/35%.
Chart 5: Value of Overall Income Tax Reduction, 2014-2022 - Couple two earner
Source: Department of Finance Budget Documents - various years.
Notes: PAYE workers. For couples with 2 earners the income is assumed to be split 65%/35%.
Income taxation and the income distribution
An insight into the distribution of income taxpayers across the income distribution is provided each year by the Revenue Commissioners. The Revenue’s ability to profile taxpayers is limited by the fact that it generally examines ‘tax cases’, or taxpayer units, which may represent either individual taxpayers or couples who are jointly assessed for tax. The latest data is the post-Budget 2022 projection by Revenue of the structure on income and income taxes in Ireland during 2022 (see table 3).
The progressivity of the Irish income taxation system is well demonstrated in Table 3 – as incomes increase the average income tax paid also increases. The table also underscores the issues associated with having a large proportion of the Irish population survive on low incomes. Summarising the data in the table, 16.6 per cent of cases have an income below €10,000; almost half have an income below €30,000 and 85 per cent of cases are below €75,000. At the top of the income distribution, 8.3 per cent of tax cases (just over 235,000) receive an income in excess of €100,000. The data also highlights the dependence of the income taxation system on higher income earners, with almost one-quarter of income tax coming from cases with incomes of between €60,000 and €100,000 and 55 per cent of income tax coming from cases with incomes above €100,000. While such a structure is not unexpected, a symptom of progressivity rather than a structural problem, it does underscore the need to broaden the tax base beyond income taxes – a point we have made for some time and develop further in Chapter 4 of our Socioeconomic Review.
Table 3: | Income Taxation and Ireland’s Earnings Distribution, 2022 | |||||
From € | To € | No. of cases | Av. income | Av. Tax & USC | Effective Tax Rate | |
- | 10,000 | 476,900 | €4,502 | €0.63 | 0.0% | |
10,000 | 13,000 | 133,100 | €11,533 | €5 | 0.0% | |
13,000 | 15,000 | 92,600 | €14,017 | €107 | 0.8% | |
15,000 | 18,000 | 130,000 | €16,423 | €169 | 1.0% | |
18,000 | 20,000 | 98,200 | €18,992 | €458 | 2.4% | |
20,000 | 25,000 | 229,400 | €22,446 | €1,046 | 4.7% | |
25,000 | 27,000 | 87,500 | €25,966 | €1,680 | 6.5% | |
27,000 | 30,000 | 111,200 | €28,192 | €1,960 | 7.0% | |
30,000 | 35,000 | 183,100 | €32,682 | €2,780 | 8.5% | |
35,000 | 40,000 | 198,700 | €37,599 | €3,900 | 10.4% | |
40,000 | 50,000 | 280,400 | €44,772 | €6,088 | 13.6% | |
50,000 | 60,000 | 209,500 | €54,687 | €9,141 | 16.7% | |
60,000 | 70,000 | 153,900 | €64,607 | €12,164 | 18.8% | |
70,000 | 75,000 | 51,400 | €72,257 | €14,553 | 20.1% | |
75,000 | 80,000 | 52,300 | €77,419 | €16,138 | 20.8% | |
80,000 | 90,000 | 79,200 | €84,912 | €18,965 | 22.3% | |
90,000 | 100,000 | 62,200 | €94,839 | €22,926 | 24.2% | |
100,000 | 150,000 | 144,300 | €119,958 | €33,687 | 28.1% | |
150,000 | 200,000 | 45,900 | €171,176 | €57,211 | 33.4% | |
200,000 | 275,000 | 23,600 | €231,059 | €85,932 | 37.2% | |
Over | 275,000 | 23,300 | €541,588 | €233,090 | 43.0% | |
Totals | 2,866,700 | €45,547 | €9,393 | 20.6% | ||
Source: Calculated from Revenue Commissioners (2021) based on projections for the 2022 income tax structure.
Indirect taxation and the income distribution
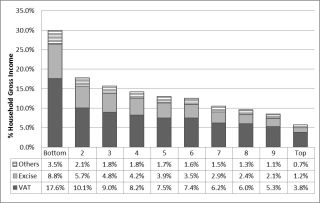
Department of Finance (2021: 50) tax forecasts for 2022 project that after income tax (€27.5bn), the second largest source of taxation revenue will be VAT (€16.9bn) and the fourth largest will be excise duties (€6.7bn). These indirect taxes tend to be regressive – meaning they fall harder on lower income individuals and households (Barrett and Wall, 2006:17-23; Collins, 2014b).
An assessment of how these indirect taxes impact on households across the income distribution is possible using data from the CSO’s Household Budget Survey (HBS), which collects details on household expenditure and income every five years. Chart 6 and Table 4 presents the results of an examination by Collins of the 2009/10 HBS data. It shows that indirect taxation consumes more than 29 per cent of the lowest decile's income and more than 13 per cent of the income of the bottom six deciles. These findings reflect the fact that lower income households tend to spend almost all of their income while higher income households both spend and save. Consequently, in our Analysis and Critique of Budget 2012, Social Justice Ireland highlighted the way that that Budget’s increase in VAT was regressive and unnecessarily undermined the living standards of low income households. Other, fairer approaches to increasing taxation were available and should have been taken.
Chart 6: Indirect Taxes as a % of Household Gross Income, by decile
Source: Collins (2014a: 18).
Note: Others include levies, vehicle taxes and TV licences.
Table 4: | Direct, Indirect and Total Household Taxation as a % of Gross Income | |||
Decile | Direct | Indirect | Total | |
Bottom | 0.72% | 29.93% | 30.64% | |
2 | 0.49% | 17.85% | 18.34% | |
3 | 1.00% | 15.66% | 16.66% | |
4 | 2.62% | 14.20% | 16.82% | |
5 | 3.97% | 13.05% | 17.03% | |
6 | 7.38% | 12.57% | 19.95% | |
7 | 10.67% | 10.53% | 21.20% | |
8 | 14.12% | 9.62% | 23.74% | |
9 | 17.27% | 8.50% | 25.77% | |
Top | 23.99% | 5.70% | 29.69% | |
|
|
|
| |
State | 13.60% | 10.36% | 23.95% | |
Source: Collins (2014a: 19), equivalised data using national scale.
Table 4 brings together data for both the indirect and direct (income taxes) payments by households across the income distribution. Although income taxes are progressive, indirect taxes are regressive and the combined picture of overall household contributions offers a more nuanced understanding of the taxes people pay. Although the indirect taxes for the bottom decile are somewhat skewed by households recording zero incomes (yet still spending, such as self-employed households), the picture from the 2nd decile upwards is one of a flat taxation system for most households, with increases only noticeable for the top three deciles.
[1]See Eurostat (2014:268-269) for a more comprehensive explanation of this classification.
Taxation Reforms
Arguments Around Taxation and competitiveness
Suggesting that any country’s tax-take should increase often produces negative responses. People think first of their incomes and increases in income tax, rather than more broadly of reforms to the tax base. Furthermore, proposals that taxation should increase are often rejected with suggestions that they would undermine economic growth. However, a review of the performance of a number of economies over recent years sheds a different light on this issue and shows limited or no relationship between overall taxation levels and economic growth.
One argument made against increases in Ireland’s overall taxation levels is that it will undermine competitiveness. However, the suggestion that higher levels of taxation would damage our position relative to other countries is not supported by international studies of competitiveness. In the annex to this chapter we compare taxation levels in Ireland to those in other leading competitive economies and find that almost all collect a greater proportion of national income in taxation.
Table 5: | Differences in Taxation Levels Between the World’s 15 Most Competitive Economies and Ireland | ||||
Competitiveness Rank | Country | Taxation level versus Ireland | |||
1 | Singapore | not available |
| ||
2 | United States | -3.1 |
| ||
3 | Hong Kong SAR | not available |
| ||
4 | Netherlands | +11.7 |
| ||
5 | Switzerland | +0.9 |
| ||
6 | Japan | +4.4 |
| ||
7 | Germany | +11.2 |
| ||
8 | Sweden | +15.3 |
| ||
9 | UK | +5.4 |
| ||
10 | Denmark | +18.7 |
| ||
11 | Finland | +14.6 |
| ||
12 | Taiwan, China | not available |
| ||
13 | South Korea | not available |
| ||
14 | Canada | +5.9 |
| ||
15 | France | +17.8 |
| ||
24 | IRELAND | - |
| ||
Source: | World Economic Forum (2019). | ||||
Notes: | a) Taxation data from OECD (2022) for the year 2020 except for Japan where the taxation data is for 2019. | ||||
| b) For some non-OECD countries comparable data is not available. | ||||
| c) The OECD’s estimate for Ireland in 2020 is 20.2 per cent of GDP. The table compares GDP taxation measures for these countries with Ireland’s figure for tax as a percentage of GNDI 27.6 per cent (see Table 4.1). | ||||
The World Economic Forum publishes a Global Competitiveness Report ranking the most competitive economies across the world.[1] Table 5 outlines the top fifteen economies in the latest version of this index, for 2019, as well as the ranking for Ireland (which comes 24th). It also presents the difference between the size of the tax-take in these, the most competitive economies in the world, and Ireland, for that year.[2]
Only one of the top fifteen countries, for which there is data available, report a lower taxation level than Ireland. Compared to Ireland almost all other leading competitive economies collect a notably greater proportion of national income in taxation. Over time Ireland’s position on this index has varied, most recently rising from 31st to 24th, although in previous years Ireland had been in 22nd and 23rd position. When Ireland has slipped back the reasons stated for Ireland’s loss of competitiveness included decreases in economic growth and fiscal stability, poor performances by public institutions and a decline in the technological competitiveness of the economy (WEF, 2003: xv; 2008:193; 2011: 25-26; 210-211). Interestingly, a major factor in that decline is related to underinvestment in state funded areas: education; research; infrastructure; and broadband connectivity. Each of these areas is dependent on taxation revenue and they have been highlighted by the report, and by domestic bodies such as the National Competitiveness and Productivity Council, as necessary areas of investment to achieve enhanced competitiveness. As such, lower taxes do not feature as a significant priority; rather the focus is on increased and targeted efficient government spending.
The Case for a Financial Transactions Tax
Recurring periods of international economic chaos of the two decades have shown that the world is now increasingly linked via millions of legitimate, speculative and opportunistic financial transactions. Similarly, global currency trading increased sharply throughout recent decades. It is estimated that a very high proportion of all financial transactions traded are speculative which are completely free of taxation.
Occasional insights are provided by surveys, the most comprehensive of which is provided by the Bank for International Settlements (BIS) Triennial Central Bank Survey of Foreign Exchange and Derivatives Market Activity. The most recent of these was conducted in April 2019 and published in late 2019. The data covered 53 countries and the activities of almost 1,300 banks and other dealers. The overall results of the survey are presented in the annex,
Relating to foreign exchange transactions, the key findings from the report were:
- In April 2019 the average daily turnover in global foreign exchange markets was US$6.6 trillion; an increase from $5.1 trillion three years earlier.
- The major components of these activities were: $1,987bn in spot transactions each day, $999bn in outright forwards, $3,202bn in foreign exchange swaps, $108bn in currency swaps, and $294bn in foreign exchange options and other products.
- 56 per cent of trades were cross-border and 44 per cent local (within countries).
- The vast majority of trades involved four currencies on one side of trades: US Dollar (88 per cent of all foreign exchange trades), Euro (32 per cent), Japanese Yen (17 per cent) and Pound Sterling (13 per cent).
- Most of this activity occurred in five countries with the UK, USA, Hong Kong, Singapore and Japan facilitating 79 per cent of all foreign exchange trades.
Relating to interest rate derivative transactions, the key findings from the report were:
- In April 2019 the average daily turnover in global interest rate derivative markets was US$5.8 trillion; this has increased by more almost 120 per cent since 2016.
- The major components of these activities were: interest rate swaps of $4,100bn, $1,900bn in forward rate agreements, and $456bn in Over the Counter (OTC) options and other products.
- Half of transactions were conducted in US$, one-quarter in Euro and 8 per cent in Sterling. Most transactions originated in the UK (50 per cent) and USA (32 per cent).
The Irish Central Bank (2019) contributes to the BIS report providing specific data for the activities of 14 reporting banks based in Ireland. They found that in April 2019:
- The estimated daily foreign exchange turnover for Ireland was US$7.2bn up from $2.2bn in 2016 (3.3 times higher).
- The estimated daily turnover in interest rate derivative markets in Ireland was US$7.3bn up from US$1.1bn (6.8 times higher).
- The importance of Ireland in both these sectors increased between 2016 and 2019. In global terms, Ireland ranks 36th in terms of foreign-exchange contracts and 21st in terms of interest-rate derivatives.
Transactions in these markets represent a mixture of legitimate, speculative and opportunistic financial transactions. Estimates continue to highlight that a very large proportion of these activities are speculative, implying that large and growing amounts of these transactions make no real or worthwhile contribution to economies and societies beyond increasing risk and instability. Taken together, the daily value of international trading in foreign exchange and interest rate derivatives markets is more than 31 times the annual GDP of Ireland, more than four times that of the UK, and almost 60 per cent of annual GDP in the USA. On an annualised basis, Irish based trading in foreign exchange markets is equivalent to 676 per cent of GDP while trading in interest rate derivatives are equivalent to 685 per cent of the annual value of GDP.
Social Justice Ireland regrets that to date Government has not committed to supporting recent European moves to introduce a Financial Transactions Tax (FTT) or Tobin Tax. The Tobin tax, first proposed by the Nobel Prize winner James Tobin, is a progressive tax, designed to target only those profiting from speculation. It is levied at a very small rate on all transactions but given the scale of these transactions globally, it has the ability to raise significant funds. In September 2011 the EU Commission proposed an FTT and its proposal has evolved since then through a series of revisions and updates. We include specific details in the annex.
The EU initially proposed a tax rate of 0.1% (one tenth of one percent) on the trading of bonds and shares and 0.01% (one hundredth of one percent) on the value of derivative agreements. The rates proposed were minimums as countries could set higher rates if they wished. The proposal was also comprehensively designed such that it captured all trades involving any EU registered entity, and all trades involving any EU issued securities. The initial proposal anticipated an annual EU-wide FTT income of between €30bn-€50bn per annum.
The subsequent development of the FTT proposal has seen slow progress at EU level. While between 9 and 11 member states have signalled a willingness to implement the proposal, the precise nature of the tax and breath of the tax base has remained under discussion. Ireland is one of the EU member states that has not, as yet, signalled an intention to implement the tax. However, it has not impeded its development under the enhanced cooperation mechanism.
EU debates are currently focused on the FTT tax base with proposals to narrow it to shares only competing with alternative views focused on retaining a wide base across shares, bonds and derivatives. There is also a considerable financial lobby working to encourage a dilution of the initial broad EU FTT proposal. The scale of this initiative is understandable, given that the tax would most likely reduce the commissions and profits associates with the speculative transactions these financial firms engage in.
However, policy makers need to be reminded that the core argument for these taxes is that they are in the broader interest as they dampen irrelevant and unnecessary financial speculation and thereby underpin the stability of European states. For societies an FTT is a win-win; less needless financial speculation and more state revenue.
Researching the Introduction of Refundable Tax Credits
During 2010 Social Justice Ireland published a detailed study on the subject of refundable tax credits. Entitled ‘Building a Fairer Tax System: The Working Poor and the Cost of Refundable Tax Credits’, the study identified that the proposed system would benefit 113,000 low-income individuals in an efficient and cost-effective manner.[3] When children and other adults in the household are taken into account the total number of beneficiaries would be 240,000. The cost of making this change would be €140m. We outline the details of this proposal in the annex.
The Social Justice Ireland proposal to make tax credits refundable would make Ireland’s tax system fairer, address part of the working poor problem, and improve the living standards of a substantial number of people in Ireland. The following is a summary of that proposal:
Making tax credits refundable: the benefits
- Would address the problem identified already in a straightforward and cost-effective manner;
- No administrative cost to the employer;
- Would incentivise employment over welfare as it would widen the gap between pay and welfare rates;
- Would be more appropriate for a 21st century system of tax and welfare.
Details of Social Justice Ireland proposal
- Unused portion of the Personal and PAYE tax credit (and only these) would be refunded;
- Eligibility criteria in the relevant year;
- Individuals must have unused personal and/or PAYE tax credits (by definition);
- Individuals must have been in paid employment;
- Individuals must be at least 23 years of age;
- Individuals must have earned a minimum annual income from employment of €4,000;
- Individuals must have accrued a minimum of 40 PRSI weeks;
- Individuals must not have earned an annual total income greater than €15,600;
- Married couples must not have earned a combined annual total income greater than €31,200;
- Payments would be made at the end of the tax year.
Cost of implementing the proposal
- The total cost of refunding unused tax credits to individuals satisfying all of the criteria mentioned in this proposal is estimated at €140.1m.
Major findings
- Almost 113,300 low income individuals would receive a refund and would see their disposable income increase as a result of the proposal.
- The majority of the refunds are valued at under €2,400 per annum, or €46 per week, with the most common value being individuals receiving a refund of between €800 to €1,000 per annum, or €15 to €19 per week.
- Considering that the individuals receiving these payments have incomes of less than €15,600 (or €299 per week), such payments are significant to them.
- Almost 40 per cent of refunds flow to people in low-income working poor households who live below the poverty line.
- A total of 91,056 men, women and children below the poverty threshold benefit either directly through a payment to themselves or indirectly through a payment to their household from a refundable tax credit.
- Of the 91,056 individuals living below the poverty line that benefit from refunds, most (over 71 per cent) receive refunds of more than €10 per week with 32 per cent receiving in excess of €20 per week.
- A total of 148,863 men, women and children above the poverty line benefit from refundable tax credits either directly through a payment to themselves or indirectly (through a payment to their household. Most of these beneficiaries have income less than €120 per week above the poverty line.
- Overall, some 240,000 individuals (91,056 + 148,863) living in low-income households would experience an increase in income as a result of the introduction of refundable tax credits, either directly through a refund to themselves or indirectly through a payment to their household.
References
- Bank for International Settlements (2019) Triennial Central Bank Survey of Foreign Exchange and Derivatives Market Activity. Basel: BIS.
- Barrett, A. and Wall C. (2005) The Distributional Impact of Ireland’s Indirect Tax System. Dublin: Combat Poverty Agency.
- Central Bank of Ireland (2019) Turnover of FX and OTC interest rate derivatives in April 2019. Dublin: Central Bank of Ireland.
- Collins M.L. (2014b) “Taxation”. In O’Hagan, J. and C. Newman (eds.) The Economy of Ireland (12th edition). Dublin: Gill and Macmillan.
- Collins, M.L. (2004) “Taxation in Ireland: an overview” in B. Reynolds, and S. Healy (eds.) A Fairer Tax System for a Fairer Ireland. Dublin: CORI Justice Commission.
- Collins, M.L. (2014a) ‘Total Tax Contributions of Households in Ireland’ NERI Working Paper, 2014/18. Dublin: NERI.
- Department of Finance (2021) Budget 2022. Dublin: Stationery Office.
- Department of Finance (various) Budget Documentation – various years. Dublin: Stationery Office.
- Eurostat (2014) Taxation Trends in the European Union. Luxembourg: Eurostat.
- Eurostat (2020) Taxation Trends in the European Union. Luxembourg: Eurostat.
- OECD (2021) Revenue Statistics. Paris: OECD.
- Revenue Commissioners (2021) Ready Reckoner - Post-Budget 2022. Dublin: Stationery Office.
- Social Justice Ireland (2010) Building a Fairer Taxation System: The Working Poor and the Cost of Refundable Tax Credits. Dublin: Social Justice Ireland.
- Social Justice Ireland (2021) Analysis and Critique of Budget 2022. Dublin: Social Justice Ireland.
- World Economic Forum (2003). Global Competitiveness Report 2003-04. www.weforum.org.
- World Economic Forum (2008) Global Competitiveness Report 2008-09. www.weforum.org.
- World Economic Forum (2011) Global Competitiveness Report 2011-12. www.weforum.org.
- World Economic Forum (2019) Global Competitiveness Report 2019. www.weforum.org.
Online databases
CSO online database, web address: http://www.cso.ie/en/databases/
Eurostat online database, web address: http://ec.europa.eu/eurostat
[1] Competitiveness is measured across 12 pillars including: institutions, infrastructure, macroeconomic environment, health and primary education, higher education and training, goods markets efficiency, labour market efficiency, financial market development, technological readiness, market size, business sophistication and innovation. See WEF (2019) for further details on how these are measured.
[2]This analysis updates that first produced by Collins (2004: 15-18). As a result of the Covid-19 pandemic, the WEF did not update their index for 2020.
[3]The study is available from our website: www.socialjustice.ie