Towards Wellbeing For All - Work and Job Quality

The Programme for Government acknowledged that our “existing measures of economic performance fail to measure matters such as damage to the environment and voluntary work. They also overlook equality of opportunity, distribution of wealth and income and only value public expenditure on the basis of the inputs used, not the outcomes achieved” and committed to introducing a series of indicators that would more accurately measure wellbeing to provide a “holistic view of how our society is faring”.
A ‘Wellbeing Dashboard’ was then developed to provide a snapshot of progress. In developing the Dashboard, the Inter-Departmental Working Group established a list of 35 indicators chosen to be balanced, add value or be of policy relevance, provide for aggregation and dis-aggregation, be readily available and of sufficient quality, and be internationally comparable.
So how are we doing? To gauge public opinion on what matters, and what should therefore be counted as an indicator of Well-being, Social Justice Ireland produced a survey asking people to rank a set of six indicators under each of the Well-being Framework dimensions from one to six, with one being the least important and six being the most important. The six indicators included the indicators used in the Dashboard and datasets readily available from the CSO and other reputable sources. This survey was circulated over the Summer months through our social media channels, our Weekly Digest, and our Members Bulletin. What follows is based on the responses to this survey and our policy proposals under each of the 11 dimensions.
Two interchangeable phrases have been used to describe those living on incomes below the poverty line: ‘living in poverty’ and ‘at risk of poverty’. The latter term is the most recent, introduced following a European Council meeting in Laeken in 2001 where it was agreed that those with incomes below the poverty line should be termed as being ‘at risk of poverty’. The results of the SILC survey provided a breakdown of those below the poverty line.
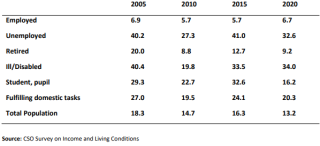
Table 1 presents figures for the risk of poverty facing people when they are classified by their principal economic status (the main thing that they do). These risk figures represent the proportion of each group that are found to be in receipt of a disposable income below the 60 per cent median income poverty line. In 2020 the groups within the Irish population that were at highest risk of poverty included those permanently unable to work due to a long-term illness or a disability and the unemployed. One in five of those classified as “fulfilling domestic tasks” (formerly “on home duties”), mainly women, have an income below the poverty line.
Table 1: Risk of Poverty Among all Persons Aged 16yrs+ by Principal Economic Status, 2005-2020

The proportion of people in employment and at risk of poverty decreased from 5.69 per cent in 2014 to 4.4 per cent in 2019. While not comparable due to a change in time series, in 2020 this rate was 6.2 per cent, decreasing to 4.4 per cent in 2021, based on EU-SILC data.
Mean weekly earnings have increased increased from €717.52 in Q4 2016 to €863.70 in Q4 2021. However, average figures conceal inequality. For example, in Q2 2022, average weekly earnings were €871.62, with a range from €404.80 in the Accommodation and Food sector (19.5 per cent below the Living Wage of €503.10 for a 39-hour week) to €1,442.80 in the Information and Communication sector.
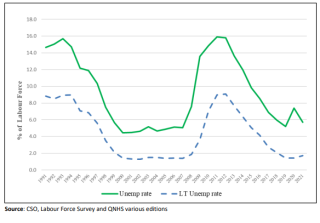
The period from 1993 was one of decline in unemployment. By late-2000 Irish unemployment reached its lowest level at 3.8 per cent of the labour force. Subsequently the international recession and domestic economic crisis brought about increases in the rate. By 2006 unemployment had exceeded 100,000 on an annualised basis for the first time since 1999 with an average of 106,325 people recorded as unemployed in mid-2006. As Chart 1 shows, it exceeded 200,000 in early-2009, 300,000 in late-2009 and peaked at 356,000 in the third quarter of 2011. The Covid-19 lockdowns caused further job losses with the numbers rapidly peaking and then declining again in 2020/21. Since then, the rate of long-term unemployment decreased from 3.2 per cent in Q2 2017 to 1.1 per cent in Q2 2022.
Chart 1: Rates of Unemployment and Long-Term Unemployment in Ireland, 1991-2021

Policy Priorities
- Implement a Refundable Tax Credit System to support the working poor.
- Launch a major investment programme focused on prioritising initiatives that strengthen social infrastructure, including a comprehensive school building programme and a much larger social housing programme.
- Recognise the challenges of long-term unemployment and of precarious employment and adopt targeted policies to address these.
- Support the widespread adoption of a Living Wage so that low paid workers receive an adequate income and can afford a minimum, but decent, standard of living.