Who is buying Ireland's new homes?

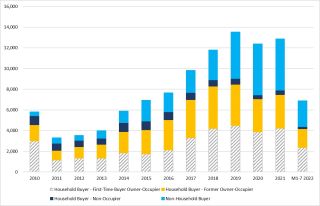
According to data from the Property Price Register released by the CSO, the number of new home purchases increased steadily from 2010 to 2019, before dipping slightly in 2020 and rising again in 2021. In 2010, just 5,805 new home purchases were executed, compared to 12,876 in 2021 and 6,878 in the first seven months of 2022. But who is buying these homes and what does it mean for property prices?
The data published by the CSO show that of the 5,805 new homes purchased in 2010, 93.3 per cent were purchased by households, with just 6.7 per cent bought by non-household (or institutional) purchasers. By 2021, the proportion of new homes purchased by households fell by one third to 61.3 per cent, while the proportion bought by non-household purchasers increased more than five-fold to 38.7 per cent. This pattern continues in the first seven months of 2022, when the split between household and non-household purchasers was 63.5% to 36.5%. Meanwhile the proportion purchased by first time buyers reduced from 51.7 per cent in 2010 to 34.2 per cent in the first seven months of this year. (Chart 1)
Chart 1: Purchases of New Properties by Purchaser Type, 2010 to M7 2022

Source: CSO PxStat HPA02 (2010-2021), HPM02 (M1-7 2022)
The increase in the proportion of new properties purchased by non-household purchasers is, on the face of it, concerning. But who are these purchasers?
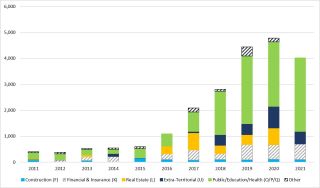
As can be seen in Chart 2, purchasers are spread across a range of NACE sectors, including Construction, Financial & Insurance, Real Estate, Extra-Territorial, Public/Education/Health, and Other. In 2011, 61.8 per cent of non-household purchases of new properties were by the Public/Education/Health sectors, while 21.8 per cent were bought by purchasers in the Construction sector. The proportion of purchases by the Public/Education/Health sector fell between 2010 and 2014 (when it was just 16.8 per cent), before increasing steadily from 2015 onwards to reach 58.6 per cent in 2021. In the same period, the proportion of new homes purchased by non-household entities in the Financial & Insurance sector increased from 20 per cent in 2012 to 30.4 per cent in 2013, before fluctuating between 2016 and 2021 (when it accounted for 12.2 per cent). Extra-territorial purchasers accounted for almost one in ten non-household purchases of new properties in 2021, down from 17.4 per cent in the previous year.
Chart 2: Non-Household Purchases of new properties by Sector, 2011 to 2021

Source: CSO PxStat HPA10
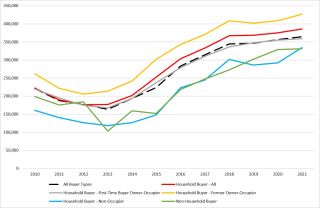
Average purchase prices for new properties have increased for all purchaser types. Between 2010 and 2021, the average purchase price of a new property increased from €220,965 to €364,717. For first time buyers, the increase went from €219,907 to €359,359, while former owner occupiers experienced the highest average purchase prices, ranging from €262,178 in 2010 to €426,976 in 2021. Average purchase prices for non-household purchasers were among the lowest, ranging from €198,715 in 2010 to €331,278 in 2021 (Chart 3), however their capacity to purchase at scale would be of concern.
Chart 3: Average Purchase Price of New Properties by Purchaser Type, 2010 to 2021

Source: CSO PxStat HPA02
There is a clear disparity between the purchasing power of household and non-household entities, even where these non-household entities are purchasing in the public good. In the midst of a housing crisis marked by increasing house prices, it is imperative that the State develop out its own sites, which would be more cost-effective in the long-run than purchasing turnkey properties, and increase the number of new properties available to household purchasers.