Income Changes – a 25-year Assessment: Welfare rates should NOT have been reduced
Was it fair to cut welfare rates in Budget 2011? Did the increases in social welfare rates in the mid-2000s justify a reduction in rates in Budget 2011? The Minister for Finance and the Government claimed the answer to both of these questions was yes. We disagree and suggest the evidence does not support the Government's claims.
Income changes: A 25-year assessment
Budget 2011 delivered a series of cuts to the take home pay of Ministers, workers and social welfare recipients. In his Budget speech, the Minister for Finance announced a reduction in the basic social welfare payment, jobseekers benefit, and signalled that further reductions should follow. Social Justice Ireland rejects the suggestion that these basic welfare rates are too high and we further question the short-sighted justification for these reductions.
Social Justice Ireland has calculated the income gains over the past quarter of a century for a range of people. Below we provide the details after tax and social insurance have been deducted.
The following should be noted about the calculations:
· Taxation is calculated on a single person basis under normal rules as this yields the lowest net pay. It could be calculated differently which would result in the nett weekly pay increase being higher for those in paid employment included in the table.
· 1086 values have been converted from pounds to euros.
· The pay for a TD is calculated on the 2011 rate for a TD with 10 years service or more. When the next Dail is elected there will be no increments available to TDs and all will earn the same basic pay of €92,672 a year.
· To allow like for like comparison, the figures do not take not account pension contributions or deductions as these are neither available nor comparable across sectors. In this context it should be noted that those at the higher income range have a much greater gain for their pension contributions compared to the others listed in the table.
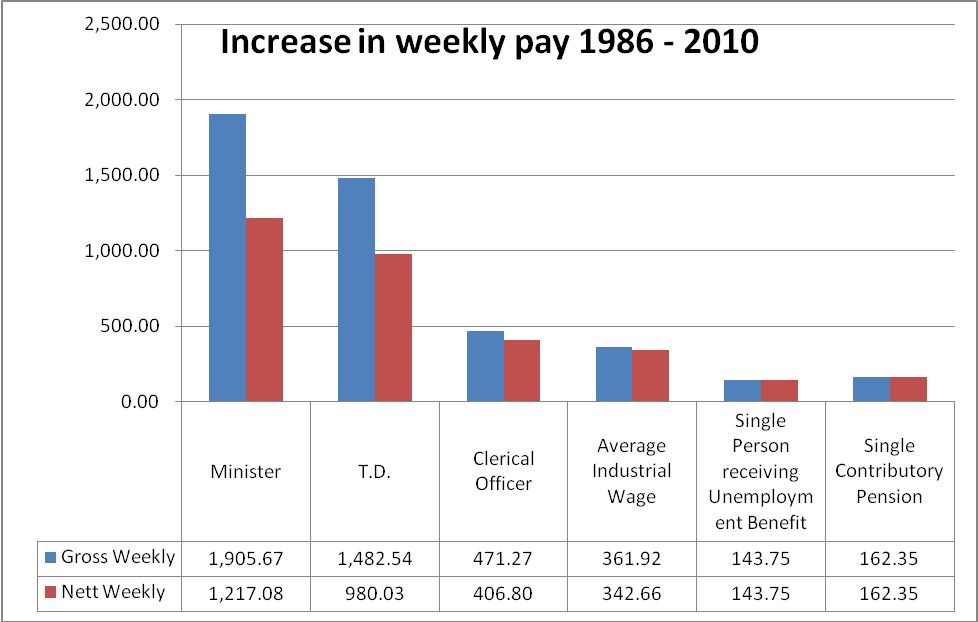
As the table above (post Budget 2011 reductions), in the past quarter century the take-homepay of TDs rose by €902 a week while unemployment benefit rates for a single person only rose by €135 in the same period. Government ministers’ take-home pay rose by more than €1,030 a week in the same period. Similarly, the take-home pay of clerical officers in the public sector rose by €406.80 a week; the take-home pay of a person on the average industrial wage rose by €342.66 a week; and the contributory old age pension for a single person rose by €162.35 a week.
These are dramatic numbers in the context of this year’s Budget and Social Welfare Act. Ministers whose take-home pay has risen by more than eight times the rise in social welfare rates proposed that social welfare rates be reduced. Likewise, a majority of TDs whose take-home pay rose by seven times the rise in social welfare rates voted to reduce welfare rates.
Other choices existed that would have enabled Government NOT to cut social welfare rates. These choices should have been taken. Social Justice Ireland has outlined these choices in its Policy Briefing on Budget Choices published in advance of the Budget and in its Analysis and Critique of Budget 2011. Both are available on this website together with a wide range of related material addressing these issues.
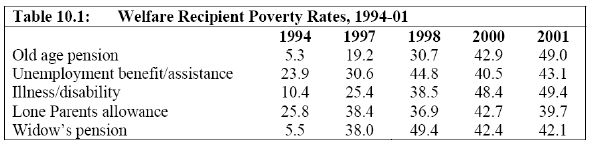
2000-07: Welfare Boom or Catching up?
A worrying feature of some commentary over the past few months has been a claim that there was a boom in welfare payments since 2000. This claim has also been repeated by some Government Ministers. These assessments tend to miss one key point—that welfare rates did increase since 2000, but that that increase followed a period, as the Celtic Tiger began to appear, where the living standards of people in Irish society had increase rapidly while welfare payments had barely changed. Table 10.1 below provides some telling evidence to reflect this. In 1994 the first Irish income distribution survey from the ESRI commenced and recorded poverty rates of 5.3% for those on old age pensions, 5.5% for those on widowed pensions and 10% for those who were ill or disabled. Seven years later these poverty rates had rocketed reflecting the fact that these groups were left behind as the economy boomed. Subsequently welfare payments did increase, but this was merely catching up so that recipients could enjoy basic living standards.