Budget Income Tax Changes since 2014

Budget 2021 follows a series of budgets over recent years that have frequently given emphasis to providing reductions in income taxation. Looking back over the past two decades, data from the Department of Finance’s income tax reports, which accompany each year’s Budget, demonstrate that the proportion of gross income paid in all forms of income taxes, levies and social insurance payments fell substantially from the late 1990s to their lowest levels in 2008. These effective taxation rates increased from 2008 to 2013, returning to levels equivalent to those that existed in 2003. Rates were unchanged between 2013 and 2014.
Since 2014 budgetary policy has provided recurring decreases in income taxes. Over three diagrams we compare the total annual value of these reductions between 2014 and 2020. The analysis captures changes to income tax rates, USC rates, social insurance rates and structures, and income tax credits. For example a single earner with a gross income of €40,000 paid €9,920 in income taxes, employee PRSI and USC in 2014 and paid €8,360 in 2020; a reduction of €1,560 per annum.
The analysis highlights a number of points. First, it provides evidence of the scale of the income tax reductions delivered over recent years; these are often overlooked, yet are substantial at the individual/household level and at the exchequer level. Second, the charts illustrate the distribution of these income tax decreases. As we have highlighted in our annual budget documents the gains have been skewed to higher income earners and households.
Chart 1: Value of Overall Income Tax Reduction, 2014-2020, Single Earner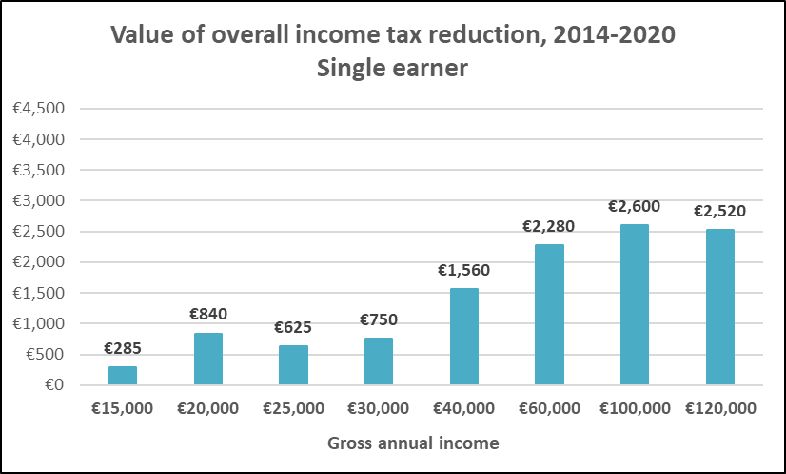
Chart 2: Value of Overall Income Tax Reduction, 2014-2020, Couple, One Earner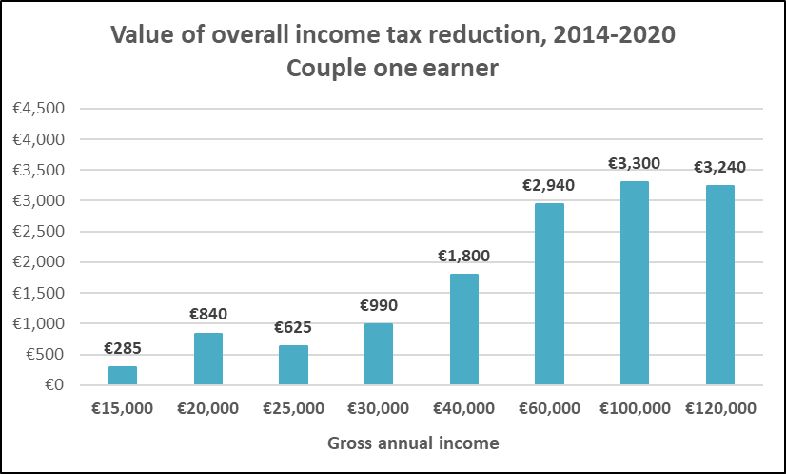
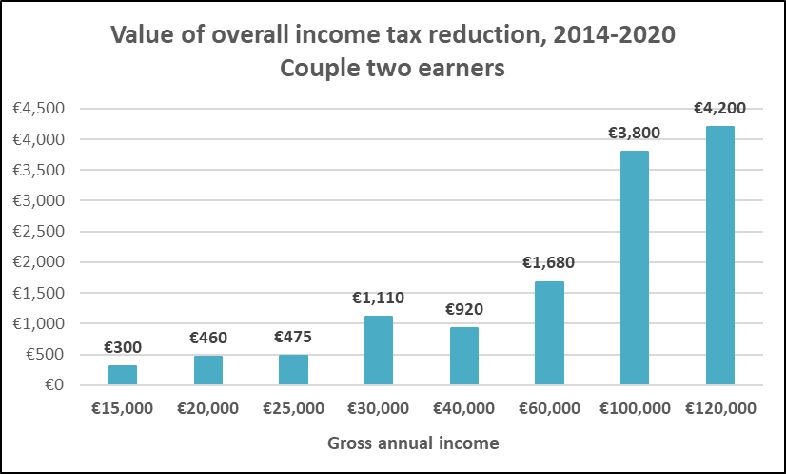
Chart 3: Value of Overall Income Tax Reduction, 2014-2020, Couple, Two Earners