c.140,000 people set to remain out of work post-Covid

The Covid-19 pandemic has brought enormous uncertainty to the Irish labour market and consequently to many families throughout the country. As this article outlines, the pandemic’s labour market impact has been uneven, in particular when judged across age groups, genders and sectors of employment. Furthermore, the uncertainty remains and many of the challenges will only truly reveal themselves as the pandemic’s disruption recedes.
Table 1 attempts to identify some of the labour market consequences of the pandemic by comparing CSO data from the final three months of 2020 to those for the same period in 2019. The table also includes the CSO’s Covid-19 adjusted employment and unemployment estimates for December 2020; these represent the lower bound for the true employment indicator and the upper bound for the true unemployment figure. Both estimates assume that most individuals in receipt of the short-term Covid-19 Pandemic Unemployment Payment (PUP) would be unemployed if the payment did not exist. The figures reveal the hidden reality of the pandemic’s labour market impact with pronounced decreases in employment and increases in unemployment. These are in addition to the existing challenges of unemployment (almost 140,000 people), underemployment (over 100,000 workers), a declining participation rate and static levels of long-term unemployment.
Table 1: | Ireland’s Labour Force Data and Covid-19 Impact, 2019–2020 | |||||
2019 | 2020 | Dec 2020-Covid | Covid - impact | |||
Labour Force | 2,471,700 | 2,445,100 | ||||
LFPR % | 62.7 | 61.3 | ||||
Employment % | 70.2 | 67.8 | 57.5 | - 10 | ||
Employment | 2,361,200 | 2,306,200 | 1,970,609 | - 335,591 | ||
Full-time | 1,868,300 | 1,871,200 | ||||
Part-time | 492,900 | 434,900 | ||||
Underemployed | 108,400 | 101,400 | ||||
Unemployed % | 4.5 | 5.7 | 19.4 | + 14 | ||
Unemployed | 110,600 | 138,900 | 468,655 | + 329,755 | ||
LT Unemployed % | 1.6 | 1.5 | ||||
LT Unemployed | 38,700 | 36,800 | ||||
Potential Additional LF | 98,700 | 162,500 | ||||
Source: | CSO, LFS Quarter 4 2020 and associated releases (CSO, 2021) | |||||
Notes: | Data is for Quarter 4 2019, 2020 and the Covid impact estimates for December 2020. LFPR = ILO labour force participation rate and measures the percentage of the adult population who are in the labour market. Employment % is for those aged 15-64 years. Underemployment measures part-time workers who indicate that they wish to work additional hours which are not currently available. LT = Long Term (12 months or more). LF = Labour Force. | |||||
An insight into the sectoral impact of these labour market changes is provided by an assessment of the change in the total number of hours worked in Ireland between late 2019 and 2020 (Table 2). Overall, there were 6.6 million less hours of work completed; either through job losses, declines in economic activity, Covid-19 related closures or reduced work hours and opportunities. However, the distribution of these reductions varies dramatically across economic sectors. Some areas saw small increases, or small declines and these contrast with dramatic reductions for sectors such as accommodation and food services (-53 per cent), cultural and recreational (-36 per cent), administrative services (-34 per cent), transport (-13 per cent), construction (-13 per cent) and retail (-5 per cent). The largest impacted sectors are frequently identified as having a larger number of female workers and low paid workers.[1]
Table 2: | Change in Total Hours Worked, Q4 2019- Q4 2020 | ||||||
2019 | 2020 | Change | % Change | ||||
All Employment | 77.4m | 70.8m | -6.6m | -8.5% | |||
By economic sector: | |||||||
Accommodation and food service | 5.1m | 2.4m | -2.7m | -52.9% | |||
Other activities (cultural and recreational) | 3.3m | 2.1m | -1.2m | -36.4% | |||
Administrative and support services | 3.5m | 2.3m | -1.2m | -34.3% | |||
Transportation and storage | 3.7m | 3.2m | -0.5m | -13.5% | |||
Construction | 5.5m | 4.8m | -0.7m | -12.7% | |||
Wholesale and retail | 9.5m | 9.0m | -0.5m | -5.3% | |||
Human health and social work | 8.9m | 8.5m | -0.4m | -4.5% | |||
Education | 5.1m | 5.0m | -0.1m | -2.0% | |||
Financial, insurance and real estate | 4.1m | 4.1m | 0.0m | 0.0% | |||
Professional, scientific and technical | 4.9m | 4.9m | 0.0m | 0.0% | |||
Information and communication | 4.7m | 4.8m | 0.1m | +2.1% | |||
Agriculture, forestry and fishing | 4.6m | 4.7m | 0.1m | +2.2% | |||
Public administration and defence | 4.0m | 4.1m | 0.1m | +2.5% | |||
Industry | 10.3m | 10.7m | 0.4m | +3.9% | |||
Source: | CSO Labour Market Insight Bulletin, Series 5 Q4 2020 – Feb 2021 | ||||||
Notes: | Data is for the final three months of 2019 and 2020 | ||||||
One of the major labour market concerns for the next few years is that many of these lost hours, or workers on temporary Government support payments, will be unable to return to work or will only be able to return to working less hours that they wish to have. As a result, the challenges of unemployment and underemployment look set to grow bigger.
Throughout the pandemic, the CSO’s Labour Force Survey (LFS) has included special questions for those in receipt of Covid-19 income support payments; either the PUP or the Employment Wage Subsidy Scheme (EWSS). Table 3 presents the results from the final three months of 2020 to the question asking individuals if they expect to return to employment. While most have or expect to return (79 per cent of recipients) one-fifth do not expect to return to their previous employment. In the absence of other employment opportunities, this suggests the potential for a transfer of these individuals from these schemes to jobseekers payments. At the end of 2020 there were approximately 335,000 individuals receiving the PUP at approximately 300,000 employees receiving the EWSS.[2] Post-pandemic, this suggests that the unemployment rate may climb to between 10 and 12 per cent of the labour force.
Table 3: | Expectation of Return to Work by Covid-19 income Support Recipients, 2020 | |||
PUP recipients | EWSS recipients | All | ||
Yes, expect to return to the same job | 64.4% | 41.3% | 33.3% | |
Yes, have already returned to the same job | 14.3% | 51.6% | 45.7% | |
No | 21.3% | 7.1% | 21.0% | |
Total | 100% | 100% | 100% | |
Source: | CSO Labour Market Insight Bulletin, Series 5 Q4 2020 (Feb 2021) |
Notes: | Data is for the final three months of 2020 |
The impact of the pandemic has also differed by age group. Chart 1 reports the CSO’s unemployment estimates from March 2020 to January 2021 for those aged 15-24 years (youth unemployment) and those aged above this. They provide two estimates of unemployment, a low estimate which reflects the normal measure of individuals without work and seeking work and a high estimate which add to this all of those in receipt of the PUP. If all claimants of the PUP were classified as unemployed, the CSO’s COVID-19 adjusted unemployment measure indicates an overall rate of 25 per cent in January 2021; 25.9 per cent for males and 24.1 per cent for females. Breaking these results down by broad age group, the estimate is 56.4 per cent for those aged 15 to 24 years and 21.4 per cent for those aged over 25 years. The data suggest the existence, and expected future growth, of a severe youth unemployment problem. Addressing this challenge will frame a core part of the policy response to the crisis in the period ahead.
Chart 1: Estimated Unemployment Rates during Coivd-19, 2020-2021
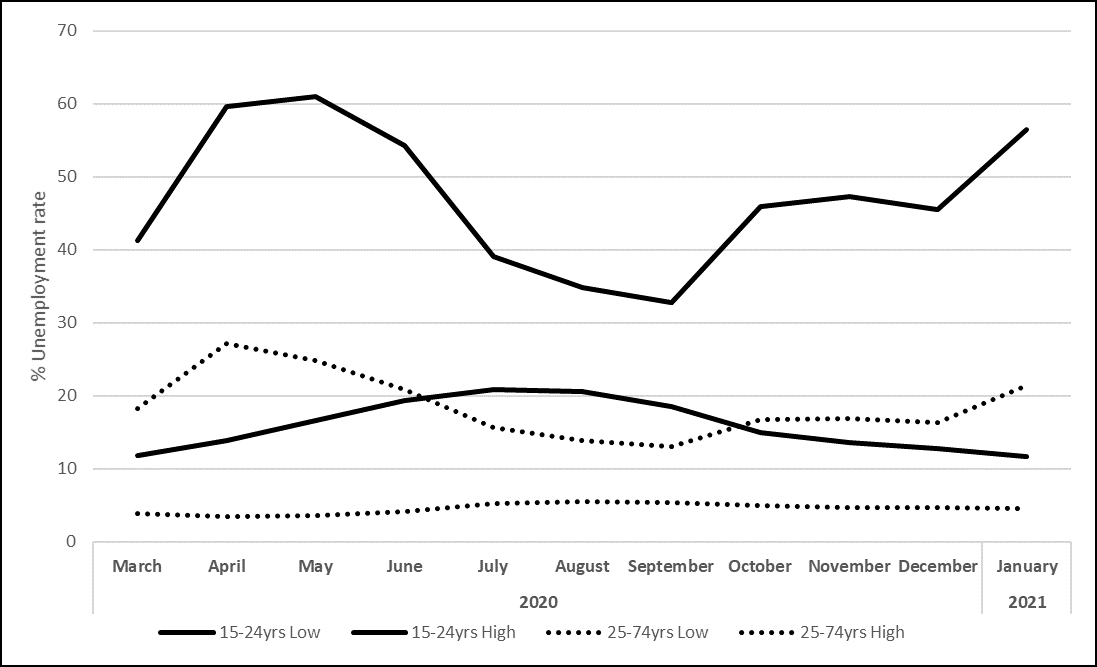
Source: | CSO on-line database, Monthly Unemployment estimates |
Note: | The low estimate is the traditional LFS unemployment figure, the high estimate includes all those in receipt of the PUP. |
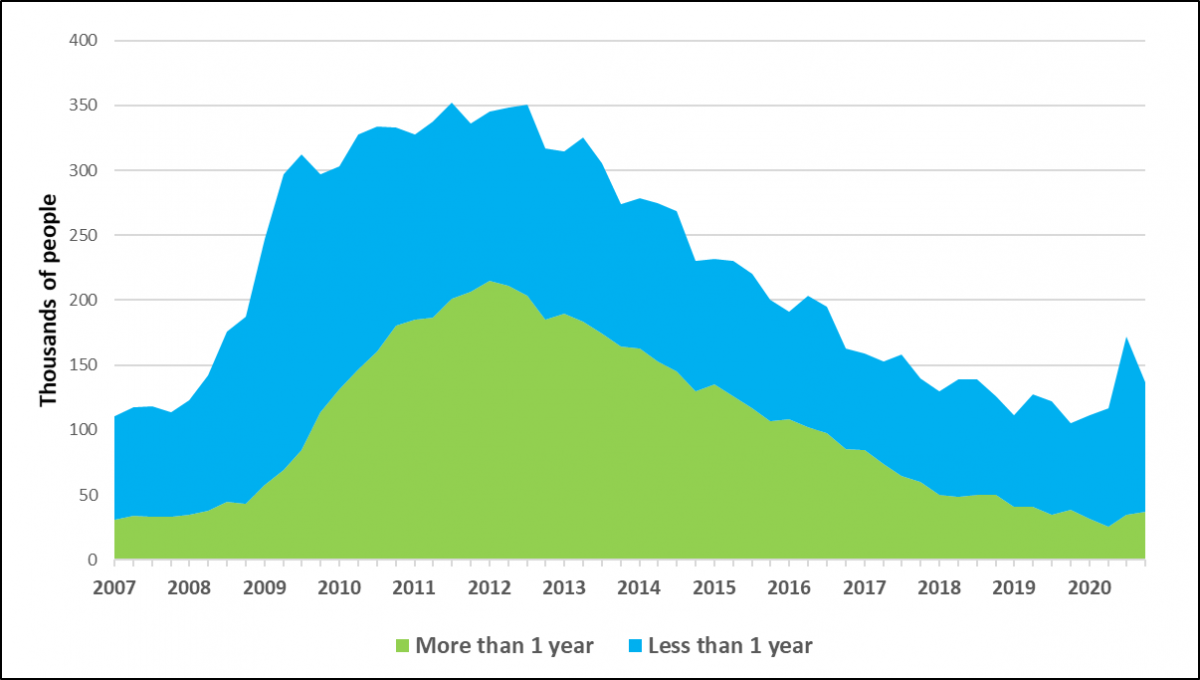
Alongside these emerging challenges, it is important not to overlook the pre-pandemic labour market issues that remain, although they are somewhat hidden by the severity of the short-term labour market impacts. In particular, long-term unemployment remains a major labour market challenge. The number of long-term unemployed was 33,300 in 2007 and increased to exceed 200,000 by 2012 before falling again to almost 37,000 in 2020 (see Table 1). For the first time on record, in late 2010 the Labour Force Survey (LFS) data indicated that long-term unemployment accounted for more than 50 per cent of the unemployed. It took from then until late 2017 for this number to consistently drop below that threshold, reaching 26.5 per cent of the unemployed in the fourth quarter of 2020. As Chart 2 shows, the transition to these high levels was rapid and it is of concern that we might once again experience such a change. The experience of the 1980s showed the dangers and long-lasting implications of an unemployment crisis characterised by high long-term unemployment rates. It remains a policy challenge that Ireland’s level of long-term unemployment remains high and that it is a policy area which receives limited attention.
Addressing a crisis such as this is a major challenge. However, it is clear that reskilling many of the unemployed, in particular those with low education levels, will be a key component of the response. Using data for the third quarter of 2019, 48 per cent of the unemployed had no more than second level education with 20 per cent not having completed more than lower secondary (equivalent to the Junior Certificate). Post-pandemic, as employment recovers and as unemployment declines, Social Justice Ireland believes that major emphasis should be placed on those who are trapped in long term unemployment – particularly those with the lowest education levels.
Chart 2: Long-Term Unemployment in Ireland, 2007-2020
Source: | CSO, LFS on-line database |
Note: | Long term unemployment is defined as those unemployed for more than one year |
Previous experiences, in Ireland and elsewhere, have shown that many of those under 25 and many of those over 55 find it challenging to return to employment after a period of unemployment. This highlights the danger of the aforementioned expected increases in long-term unemployment and the potential for the emergence of a large structural unemployment problem in the years immediately ahead. Given this, Social Justice Ireland believes that a major commitment to retraining and re-skilling will be required in the years ahead.
[1] The CSO estimates do not provide a gender breakdown.
[2] As of January 2021, the CSO have been unable to release data for the Revenue Commissioners administered EWSS although estimates have been provided as part of parliamentary replies. The January 2021 PUP figure was considerably higher at 479,000 individuals.