Distributional effects of the last 4 Budgets

As the first Budget of the Government of the 33rd Dáil approaches in October, it is interesting and instructive to analyse the distributional impact of tax and benefit changes that were implemented by the government of the last Dáil in the government's annual budget. Below, we display the effects of the four budgets on households across Irish society. As different priorities can be articulated for each Budget, it is useful to bring together the cumulative effect of policy changes on various household types across a number of years.
The charts below illustrate the combined effects of all Budgets delivered over the period from October 2016 to October 2019. The results give an insight into the distribution of resources and policy priorities of the last government.
The examined are spread across all areas of society and capture those with a job, families with children (under 12 years), those unemployed, and pensioner households. Within those households that have income from a job, we include workers on the minimum wage, on the living wage, workers on average earnings and multiples of this benchmark, and families with incomes ranging from €25,000 to €200,000.
Our analysis does not take account of other budgetary changes, most particularly to indirect taxes (VAT and excise), other charges (such as prescription charges) and property taxes. Similarly, it does not capture the impact of changes to the provision of public services or the welfare and employment supports introduced in 2020 as part of the response to Covid-19. As the impact of these measures differs between households it is impossible to quantify precise household impacts and include them.
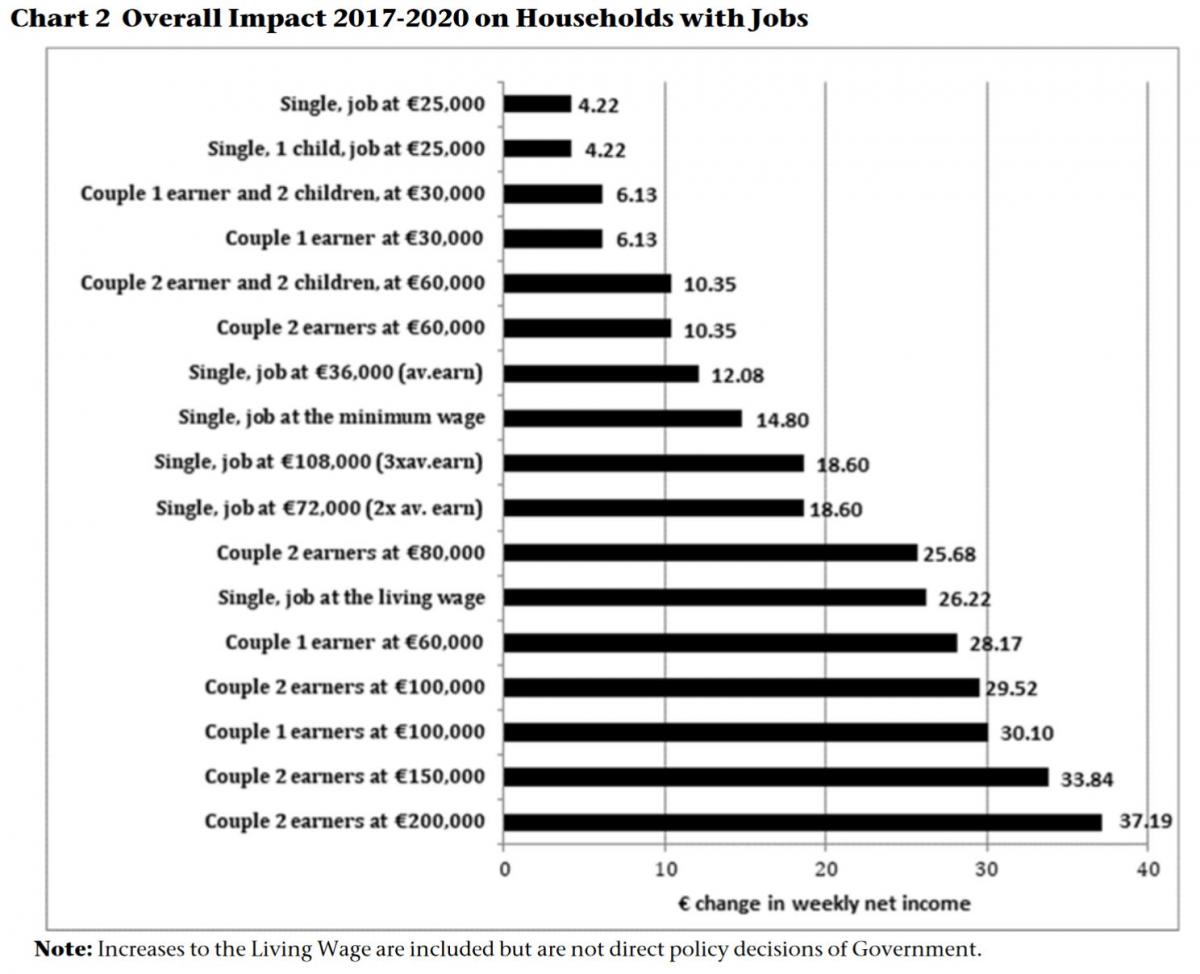
Over the years examined all household types record an increase in disposable income. Among households with jobs (see chart 2), the gains experienced range from €4.22 per week (for single workers on €25,000) to almost nine times as much, €37.19 per week, for a couple with two earners on €200,000. Overall, across these households the main gains have flowed to those on the highest incomes. In particular the chart highlights that low to middle income earners, those earning at or below €30,000 a year, are being left out – beneficiaries of neither welfare increases nor the income tax reductions which have, in general, favoured higher earners.
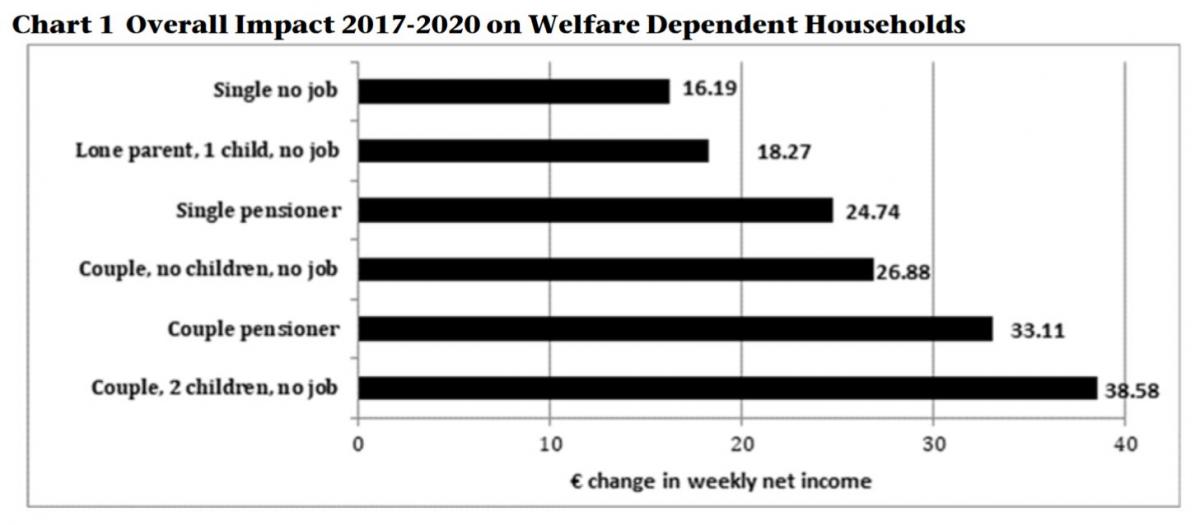
Among households dependent on welfare, the gains have ranged from €16.19 per week (to single unemployed individuals) to €38.58 per week to unemployed couples with two children (see chart 1). Our analysis points towards the choices and priorities made over these years. Overall, these choices have given least to single welfare-dependent households and those on the lowest earnings.