Employment performance varies greatly by region

Last week, the Central Statistics Office (CSO) released the most recent Labour Force Survey (Q4, 2019). The survey is the main source of data on employment in Ireland and is an excellent resouce for analysis. Last week we looked at data on labour force particiption in Ireland by age and gender. This article looks at some interesting regional trends.
For the purpose of their analysis, the CSO uses the NUTS 3 regional divisions. According to this method, Ireland is divided into 8 geographical regions: Dublin, Mid-East (Kildare, Meath, Wicklow and Louth), Midlands (Laois, Offaly, Longford and Westmeath), Mid-West (Clare, Tipperary and Limerick), West (Mayo, Roscommon and Galway), Border (Donegal, Cavan, Monaghan, Sligo and Letirim), South-West (Kerry and Cork), and South-East (Carlow, Kilkenny, Wexford and Waterford).
Unemployment Rate
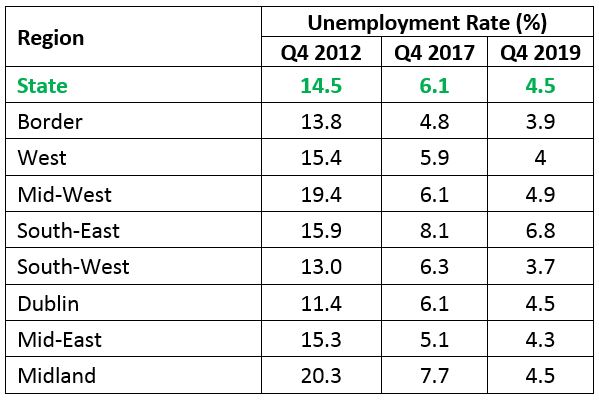
When analysing employment, often the first concern is the unemployment rate. According to the Labour Force Survey (LFS), the national unemployment rate in Q4 2019 was 4.5 per cent. There were significant variations nationally, with rates of 3.7 in the South-West and 3.9 in the Border region, and 6.8 per cent in the South-East.
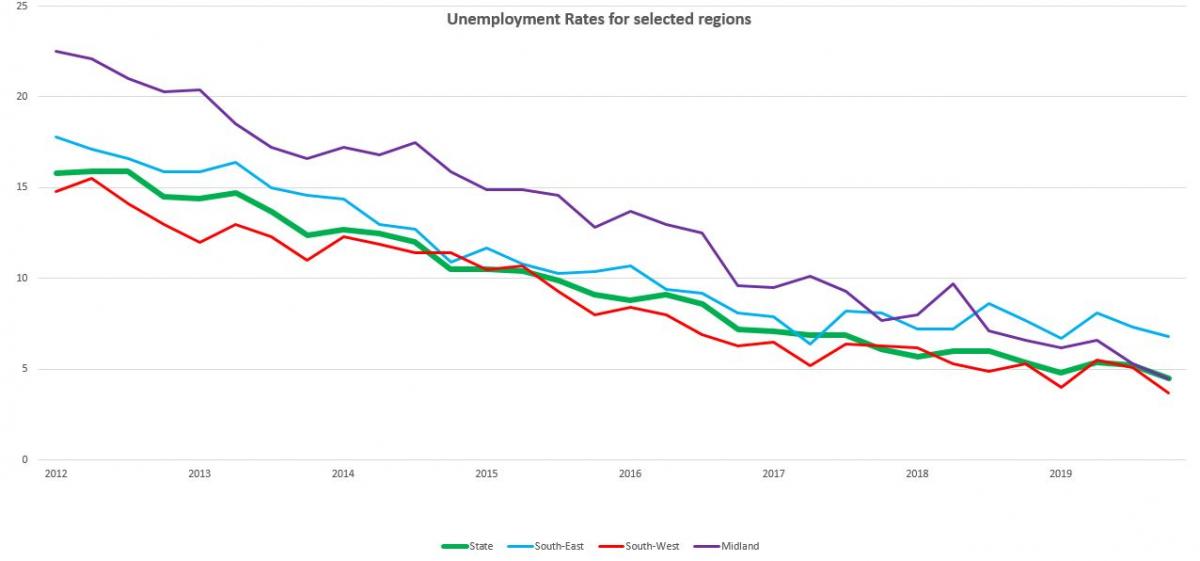
The Midland region has seen the sharpest fall in its unemployment rate in the last two years. It fell from 7.7 per cent in Q4 2017 to 4.5 per cent (the national average) at the end of 2019. At the end of 2017 it was, along with the South-East, the worst performing region in the country in terms of the unemployment rate. While the Midlands rate has converged on the national average, the South-East remains the region with the highest unemployment rate in Ireland; a full 2.3 per cent above hte national average.
The unemployment rate in the South-West has also fallen significantly over the last two years, from 6.3 per cent to 3.7 per cent, leaving it the best performer. Dublin, with an unemployment rate of 4.5 per cent, is exactly at the national average. This might seem unusual, given that much anec dotal evidence suggests that Dublin's economy is thriving. However, as will be shown, Dublin's superior performance means it is something of a magnet for people looking for jobs, with that influx helping to keep the unemployment rate higher than it otherwise would be.
The table and chart below illustrate the unemployment rate in each of the regions, along with some historical context. It is worth drawing attention, again, to the huge gains made by the Midland region in particular over the period.
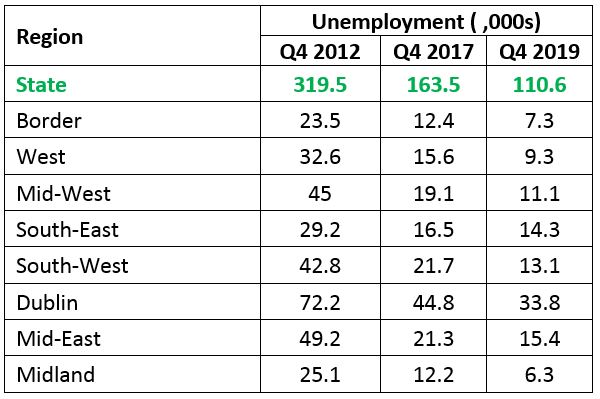
Unemployment Numbers
In terms of absolute numbers of those unemployed, it is unsurprising that Dublin has the highest number, at 30 per cent of the national total. The midland region has (approximately) just 6,300 unemployed people, but it is also the least populated region.
Employment Numbers
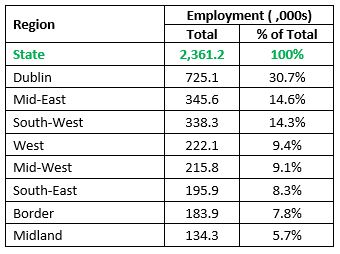
Unsurprisingly, Dublin has the highest employment numbers; three in every 10 jobs in the State are in Dublin. The Mid-East (effectively the area surrounding Dublin) and South-West (which inlcudes Cork city) each account for roughly 15 per cent of employment in Ireland.
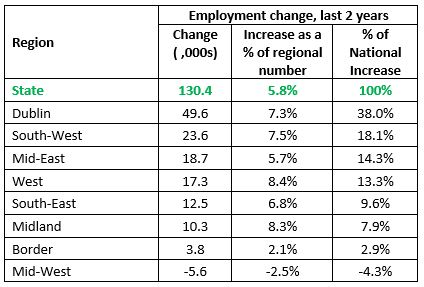
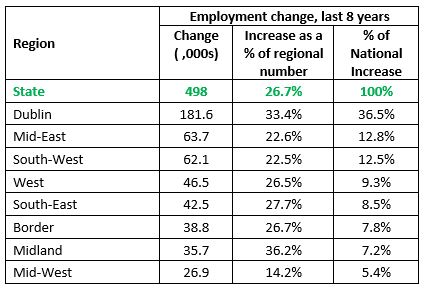
The tables below show the changing situation in employment numbers over the last number of years. The first shows the changing situation over the last two years. The second shows over the last eight years, or essentially since the recovery began.
Dublin (33.4 per cent) and the Midlands (36.2 per cent) have seen the largest increases in employment in the last 8 years as a proportion of where they stood at the beginning of 2012. The worst performer has been the Mid-West region (14.2 per cent increase in eight years). All other regions were roughly around the national average; Ireland's overall employment increased by approximately 27 per cent between Q1 2012 and Q4 2019. This was approximately half a million additional jobs.
The picture looks even more bleak for the Mid-West looking at the last 2 years. Employment actually fell in the region by 2.5 per cent between Q4 2017 and Q4 2019. Employment growth has been slow in the Border region over the same period, at 2.1 per cent. All other regions either equalled or exceeded the national average over the last two years.
38 per cent of the employment created in the last two years has been created in Dublin. The South-West also appears to be performing well, with 18 per cent of all jobs created being created there.
Labour Force numbers
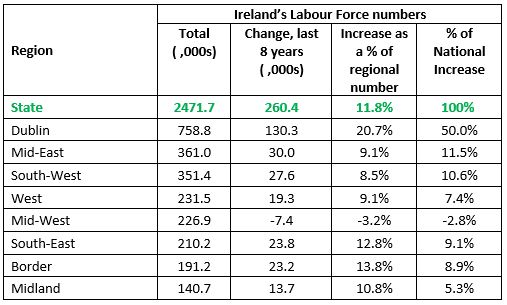
The table below shows overall labour force numbers for the State and for each of the eight regions, as well as; the change in the last eight years in terms of absolute numbers; as a percentage of the situation in 2012; and as a percentage of the national increase.
Dublin has accounted for fully half the inrease in the Irish labour force since the beginning of 2012. This is a clear indication of the strength of the Dublin economy and the disproportionate influence it has on the Irish economy. Similar to the section above measuring employment numbers, the Mid-West is the only region that saw a fall in the labour force over the eight years measured.
Absolute numbers in the Labour Force is an interesting proxy for strength of economic performance of a region. Regional Labour Force numbers are unlikley to grow much faster than the national average without people moving to the region intent on finding work. It is noteworthy that Dublin's share of the national increase in Labour Force numbers is more than four times higher than any other region.
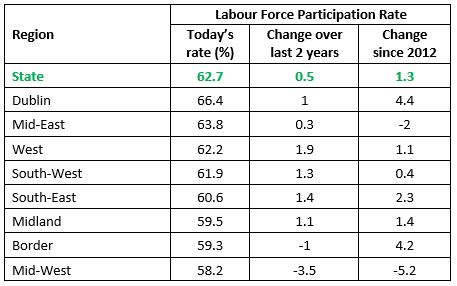
Labour Force Participation Rate
Previous articles on this website have analysed the Irish Labour Force Participation Rate (LFPR) and shown that Ireland's increased employment and low unemployment rates are occurring in the context of a notably lower participation rate compared to the previous employment peak.Ireland's current LFPR is 62.7 per cent, much lower than the 67.4 per cent recorded in Q3 2007, which was the peak of Ireland's labour market performance prior to the financial crash of 2008. This number is half a percentage point higher than a year ago, though the rate has hovered around 61 per cent the last eight years, showing no sign of returning to pre-recession levels.
Unfortunately, numbers for the LFPR by geographical region are only available from 2012 onwards, so we are not in a position to tell which regions have been the main drivers of this reduced participation rate over the last 13 years. However, it is still interesting to see how the rates compare across regions, and what the trends have been since 2012. Once again, Dublin is the best performer. It is also interesting to note that the Mid-East - essentially the region that surrounds Dublin - is the only other region where the LFPR is above the national average. This should worry policymakers, as not only does Ireland have a lower participation rate than in the past but the current rate is being artificially dragged up by the Dublin region, with the rest of country performing quite poorly by comparison.
The LFPR is as low as 58.2 per cent in the Mid-West, where is has fallen by 5.2 percentage points in the eight years since the onset of Ireland's economic recovery.
The Border region has seen the most impressive paricipation growth since 2012 (with the exception, of course, of Dublin), but even so it remains the region with the 2nd lowest rate, and the rate has in fact fallen in the last two years.