Increasing numbers in need of long-term, sustainable housing solutions as housing cost burden in the private rented sector unsustainable

Housing continues to dominate policy discussions, with lack of availability and affordability being central issues. However, according to data released by Eurostat, Ireland has the lowest housing cost relative to disposable income in the EU-15, at 16.1% (Chart 1).
Chart 1: Share of housing costs in disposable income, 2009-2017
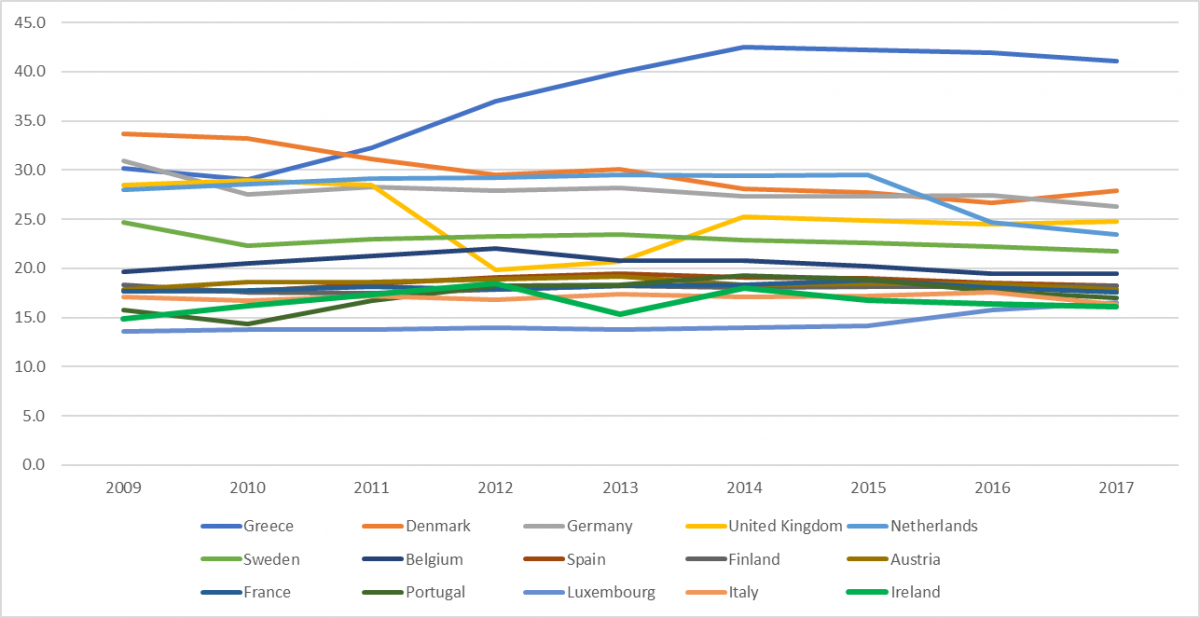
Source: Eurostat, [ilc_mded01]
How is this possible at a time of persistent rent inflation and mortgage interest rates among the highest in the Eurozone? Unfortunately this particular dataset is not available by tenure (i.e. owner occupied / rented), but an analysis of related datasets does provide a clearer picture.
Eurostat data relating to the distribution of the population by tenure status shows that Ireland ranked 4th of the EU-15 for the proportion of the population identified as ‘owner, no outstanding mortgage or housing loan’, 1st for the proportion of the population identified as ‘tenant, rent at reduced price or free’, and 15th for the proportion of population identified as ‘tenant, market rent’ (Table 1). Having a comparatively high proportion of the population with no mortgage and reduced or free rent would obviously have an impact on the overall comparative housing cost data.
Table 1: Distribution of population by Tenure Status, 2017
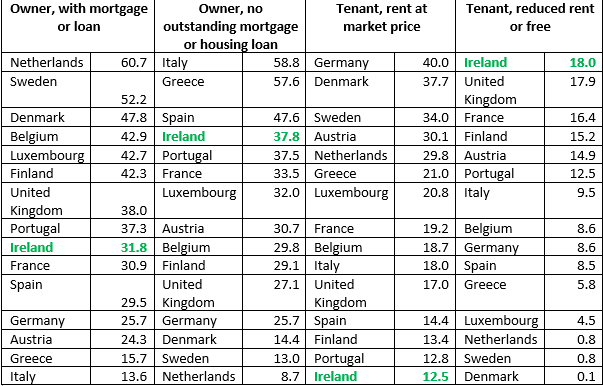
Source: Eurostat, [ilc_lvho02]
However, this does not explain why so many people are experiencing severe difficulties making ends meet and referencing spiralling housing costs as the issue. For an explanation of why this might be the case, we need to look at the proportion of the population who are paying rent at the market rate.
Tenant, market rate
Ireland’s distribution of the population paying private rent is relatively low compared to our EU-15 counterparts (Chart 2).
Chart 2: Distribution of population by tenure status, Tenant, market rent, EU-15 2009-2017
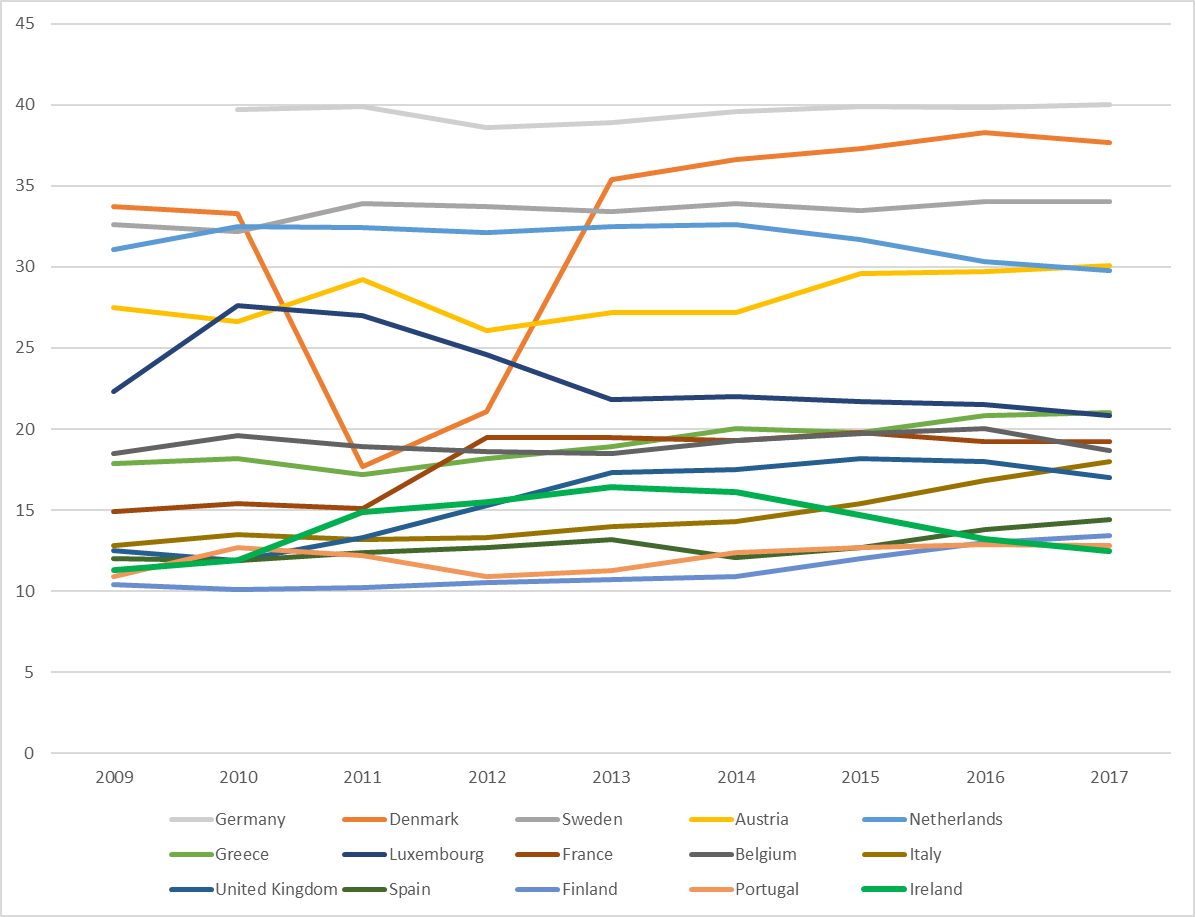
Source: Eurostat, [ilc_lvho02]
As can also be seen in Chart 2, this proportion increased between 2009 and 2013 before declining in subsequent years to 2017. There is a direct correlation between the distribution pattern of the proportion of the population ‘Tenant, market rent’ and that of ‘Tenant, rent at a reduced price or free’ (see Chart 3). As there has been no discernible increase in local authority rented accommodation, and subsidies such as the Housing Assistance Payment are discounted in the Eurostat dataset, it is likely that this indicates an increase in ‘couch surfing’ and those staying with family and friends.
Chart 3: Distribution of population by tenure status, Tenant, market rent and Tenant, rent at a reduced price or free, Ireland 2009-2017
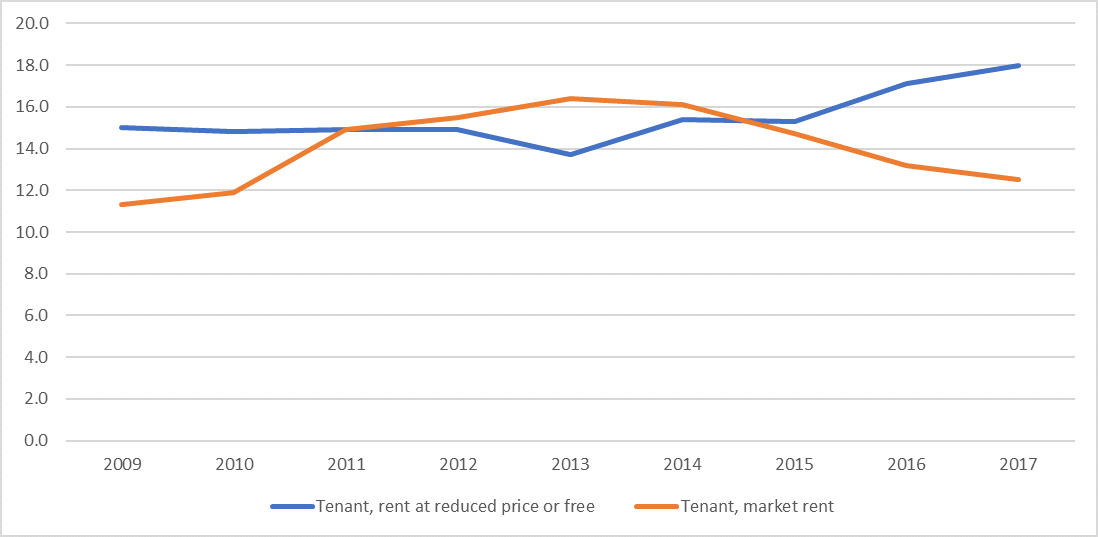
Source: Eurostat, [ilc_lvho02]
There is also an inverse correlation between the distribution of the population ‘Tenant, market rent’ and the housing cost burden of this cohort at each of the indicator points listed by Eurostat, that is those paying more than 25%, 40%, 50%, 60% and 75% of their disposable income towards housing costs (Chart 4). Here you will see that the housing cost burden fluctuates between 2009 and 2014 before increasing steadily to 2017.
Chart 4: Distribution of population by housing cost burden and tenure status, Tenant, market rent, Ireland, 2009-2017
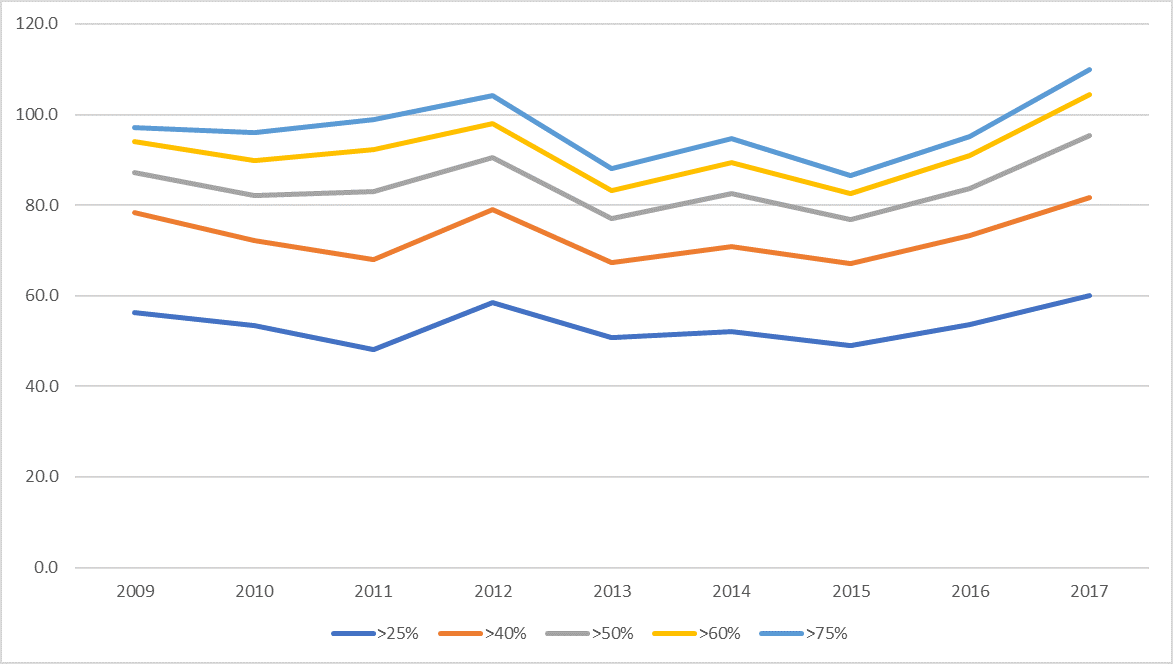
Source: Eurostat, [ilc_lvho28]
But what does that mean in real terms? And how do we compare with our EU-15 counterparts? The answers to both of these questions can be found in Table 2.
Table 2: Distribution of housing cost burden and tenure status, Tenant, market rent, EU-15, 2017
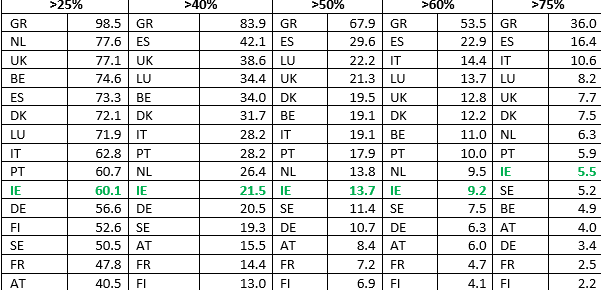
Source: Eurostat, [ilc_lvho28]
As can be seen above, Ireland ranks 10th in the EU-15 in terms of the proportion of the population for which housing costs represent in excess of 25%, 40%, 50% and 60% of disposable income, rising to 9th when the housing cost burden increases to in excess of 75%. According to the Residential Tenancies Board, there were 313,002 private registered tenancies at the end of 2017 (not including AHB tenancies). Based on this data, Table 3 shows the real impact of the housing cost burden for private rented tenants.
Table 3: Distribution of housing cost burden by tenure status, Tenant, market rent, and number of tenancies, Ireland 2017
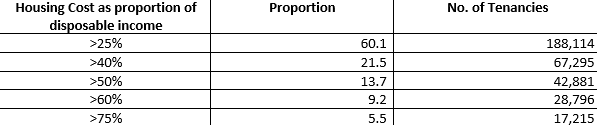
Source: Eurostat, [ilc_lvho28]; RTB Annual Report 2017; author’s own calculations
Almost 1 in 10 tenants, 28,796 tenancies, spent more than 60% of their disposable income on housing costs in 2017, with 1 in 20, 17,215 tenancies, spending over 75%. With an average of 2.1 occupants per tenancy (according to the RTB Annual Report), this equates to 141,320 people with a housing cost burden of more than 40%, of which 60,472 people have a housing cost burden of more than 60% and 34,430 have a housing cost burden of more than 75%. This is unsustainable.
A recent research report from the Irish Government Economic and Evaluation Service (IGEES) indicates that 86.5% of private tenants would like to own their own home, with a strong preference towards houses, irrespective of increased housing costs and longer commuting distances. While not surprising, given the housing cost burden in the private rented sector, this has serious implications for policy makers. Many households are still bearing the brunt of the financial crash of 2007/08, particularly those in late-stage mortgage arrears. Macroprudential measures introduced by the Central Bank of Ireland in response to formerly lax regulation and policy has resulted in a constriction of lending and housing costs continue to rise.
Moves towards an afforable rental model, cost rental, are welcome but need to be scaled up and coupled with robust tenant protections to provide for sustainable, long-term and affordable housing solutions.