Outpatient Waiting lists increase by almost 50% as health service in crisis

In November 2019, over half a million people, 563,410, were on waiting lists for outpatient procedures, according to data released by the National Treatment Purchase Fund (www.ntpf.ie). Outpatient waiting lists have increased, year-on-year, since 2014, with the largest percentage increase between 2016 and 2016 (14.3%), and an overall increase between 2014 and 2019 of 47.5% (Chart 1).
Chart 1: Outpatient Waiting Lists, 2014 to 2019
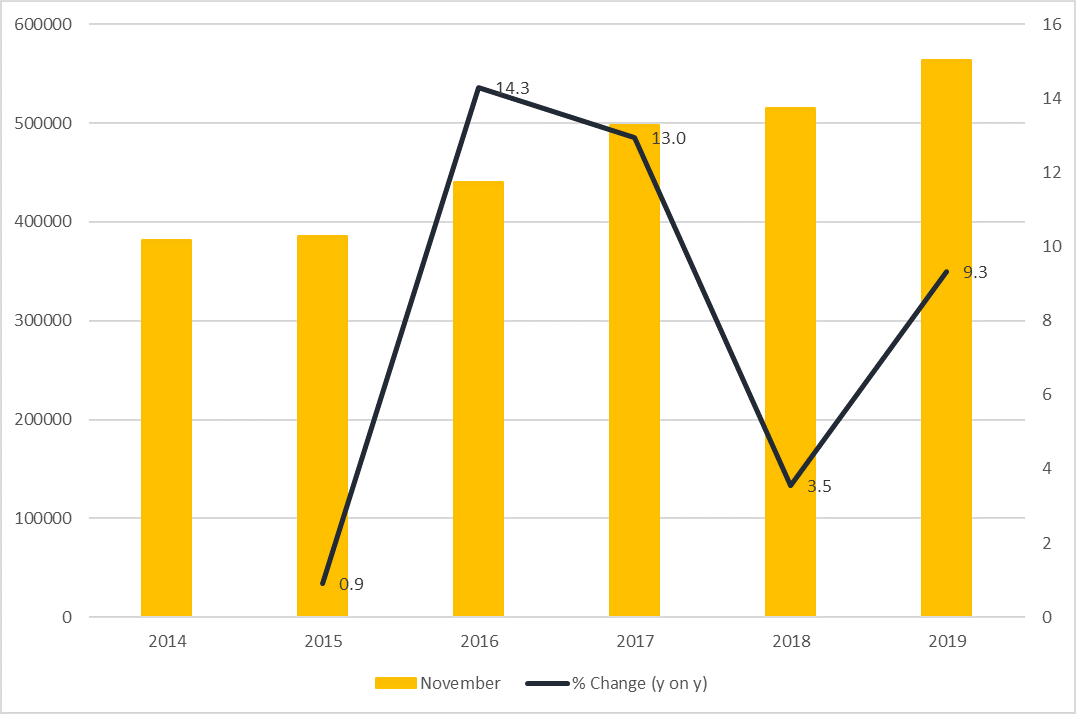
Source: National Treatment Purchase Fund, Outpatient / Waiting Lists, Group Hospitals, Various Years
Note: Data relates to November each year
Of these, almost a quarter are aged 65 and over (133,275) and 14.5% are aged between 0 and 15 years old (81,460) (Table 1).
Table 1: Outpatient Waiting by Age Group and Length of Time (Number of People), November 2019
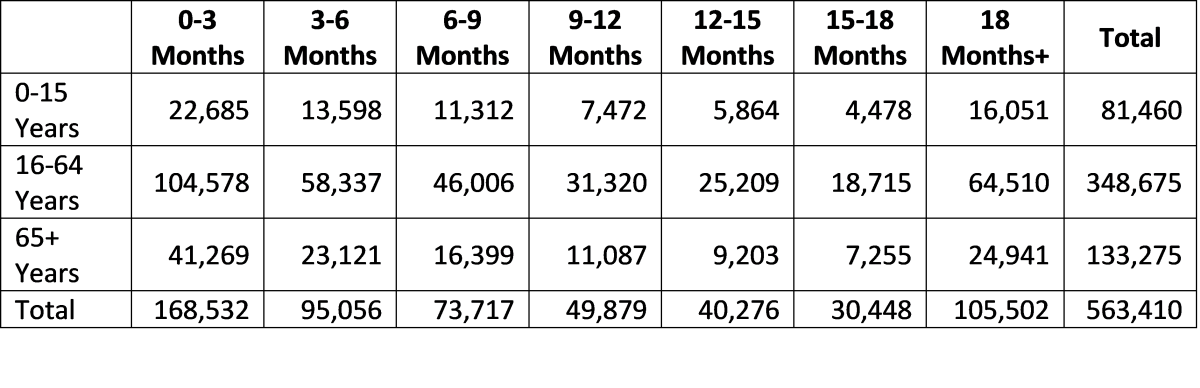
Source: National Treatment Purchase Fund, Outpatient / Waiting Lists, Group Hospitals, November 2019
The distribution of waiting times is relatively even across all age groups, with between 27.8% and 31% on the list between 0-3 months and just under 20% of all age groups on the list 18 months or more (Chart 2).
Chart 2: Outpatient Waiting by Length of Time, by % of each Age Group, November 2019
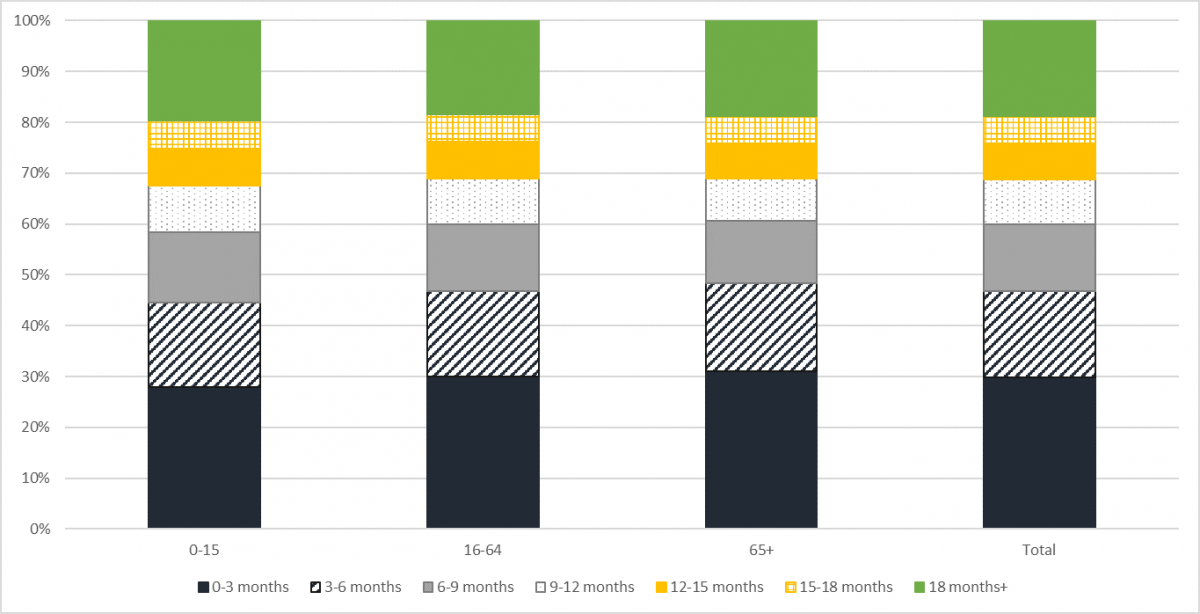
Source: National Treatment Purchase Fund, Outpatient / Waiting Lists, Group Hospitals, November 2019
This is notwithstanding the Government’s commitment, referred to in the Euro Health Consumer Index 2017 (p.16) with reference to a memo from the HSE and Department of Health referred to in the Euro Health Consumer Index 2017 (p.16), in response to the 2015 publication, advised of to a programme to reduce waiting lists to no more than 18 months. Even where that target is reached, the Index stated, it will still be the worst waiting time situation in Europe. Following a decrease of 38% between 2014 and 2015, the number of outpatients on waiting lists for 18 months or more increased year on year to November 2019 (Chart 3). The largest percentage year-on-year increase was between 2015 and 2016 (206.5%). Between November 2014 and November 2019, the number of outpatients waiting 18 months or more increased by 579.4%.
Chart 3: Outpatient Waiting List, 18 Months+, 2014 to 2019
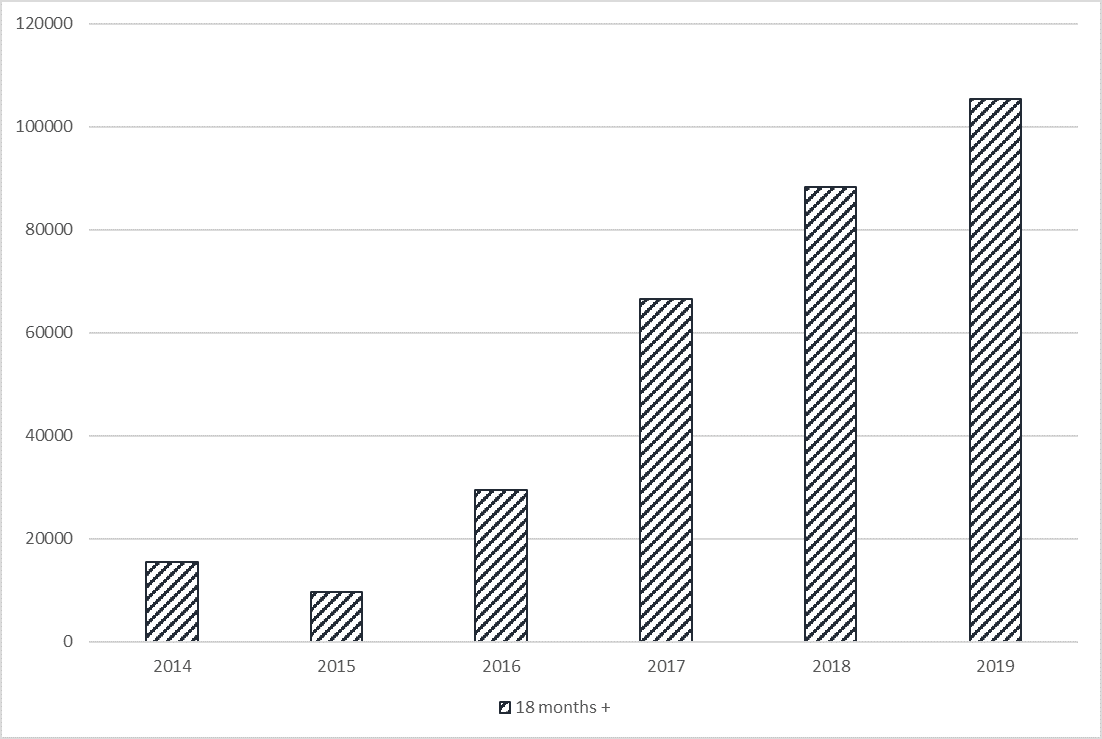
Source: National Treatment Purchase Fund, Outpatient / Waiting Lists, Group Hospitals, Various Years
Note: Data relates to November each year
38.9% of those waiting 18 months or more for an appointment were either children or the elderly.
The largest cohort of outpatients (66,447 in total) were awaiting Orthopaedic treatment, followed by those awaiting Otolaryngology (ENT) – ear, nose and throat (65,618). Patients awaiting treatment in respect of the ear, nose and throat, were also the most likely to be waiting the longest, with 21,559 on the waiting list for 18 months or more, accounting for over 20% of all patients waiting this length of time. Apart from Small Volume Specialities (where there are less than five patients waiting in a particular speciality or hospital), Paediatric Oncology, Paediatric Anaesthetics and Obstetrics were the specialities least likely to have waiting lists (Table 2).
Table 2: Outpatient Waiting Lists by Speciality, November 2019

Source: National Treatment Purchase Fund, Outpatient / Waiting Lists, Group Hospitals, November 2019
Waiting lists disproportionately affect those on low incomes and those who cannot afford private healthcare, creating a two-tiered health system. With an increasing and ageing population, the Government must design services that are inclusive for all, and support those who are most vulnerable.