Policy must address precarious housing situations

Social Housing Needs Assessments – The Numbers
According to the Summary of Social Housing Needs Assessments 2019, published in December 2019, there were 68,693 households on the waiting list for social housing, presenting as a decrease of 4.4 per cent on the previous year. However, the truth is that the housing crisis is worsening as Government continues to look to the private sector for solutions.
In 2011, the number of households assessed as having a social housing need was 98,318 – the highest number since 1993 (when it was 28,200). A change in the way need was calculated, and a removal of duplicates, saw this number reduce in 2013 to 89,872. The introduction of HAP, and the transfer of households in long-term receipt of Rent Supplement to this payment further reduced these numbers. Households in receipt of HAP are deemed to have their social housing need met and are not counted in the Summary of Social Housing Assessments, the official figure used to determine need. This means that households who would, pre-2014, have been given Rent Supplement and included in the social housing waiting list data, are no longer included. It also means that, notwithstanding the fact that the actual circumstances of those households that were transferred from Rent Supplement to HAP may not have changed, they have been removed from the list.
There has also been some debate surrounding the methodology used by local authorities in collecting information about those still on the housing waiting list, namely an ‘opt in’ letter requesting information on housing status which, if not returned, results in automatic removal from the list. While discretion was given to local authorities to make further contacts by telephone and text message, this method of data collection adversely affects those with low literacy skills and those with reduced capacity to engage in this manner, whether through stress or other socio-economic factors. It therefore risks excluding the most vulnerable households and could be a contributory factor to the rising rate of family homelessness.
Another factor may be that while those in receipt of Rent Supplement are counted, and account for 28.6 per cent of households on the social housing waiting list, those in receipt of the HAP, living in local authority rented accommodation, accommodation under the Rental Accommodation Scheme, accommodation provided under the Social Housing Capital Expenditure Programmes or any households on the transfer list are not counted as in need of social housing assistance. Over 10,500 households were transferred from Rent Supplement to HAP between 2016 and 2018 (data not available for 2019). Rent Supplement transfers accounted for 18.5 per cent of the total number of HAP tenancies in 2018. We have previously discussed the precariousness of these tenancies. While they continue to be omitted from official statistics on housing need, policy in this area will continue to focus on short-term fixes, rather than long-term solutions.
Social Housing Needs Assessments – The People
Of the 68,693 households on the waiting list, the highest proportion is in Dublin (43.3 per cent), followed by Cork (10.5 per cent), Kildare (4.9 per cent) and Galway (4.6 per cent). The age profile of households on the waiting list has changed little in the last two years, with the highest proportion being those aged between 30-39 years old (31.1 per cent), followed by those aged between 40-49 years old (23.7 per cent) – the ages of peak family formation - and those aged between 50-59 years old (14.5 per cent). Households with a reference person aged 60 and over account for almost one in ten households on the social housing waiting list (9.5 per cent). This is unsurprising, given the length of time households are waiting for social housing, with 48.7 per cent waiting four years or more, and 26.9 per cent, or 18,454 households, waiting more than seven years.
Families and multi -adult households accounted for 52.5 per cent of all households on the social housing waiting list in 2019, while single person households accounted for 47.5 per cent. Over five per cent (5.3 per cent, 3,649 households) cited ‘overcrowding’ as the main need for social housing in 2019 compared to 4.8 per cent (3,465 households) the previous year. Census 2016 reported a 28 per cent increase in overcrowding (from 73,997 permanent households to 95,013) in the intercensal period from 2011 to 2016, accounting for close to 10 per cent of the population.
The majority of households on the social housing waiting list (60.3 per cent) are entirely dependent on social welfare income, demonstrating its inadequacy as a living income. Over half (52.8 per cent) of households on the social housing waiting list in 2019 were living in private rented accommodation, compared to 59.1 per cent the previous year. This decrease, coupled with the corresponding increase in the proportion of households living with parents (21.5 per cent, compared to 19.1 per cent in 2018), relative or friends (8.9 per cent, compared to 7.6 per cent in 2018) or emergency accommodation (8.5 per cent, compared to 6.6 per cent in 2018) shows just how unsuitable the private rented sector is at providing sustainable housing for low income households. It must also be restated at this point that households whose “social housing solution” has been a Housing Assistant Payment in respect of a tenancy in the private rented sector are not counted within these data.
Those households who cited their tenure status as ‘owner occupier’ increased from 1.7 per cent (1,216 households) in 2018 to 2.1 per cent (1,439 households) in 2019. With the persistent level of late stage mortgage arrears, the increase of mortgage sales to private investment funds, and the corresponding reduction in borrower protections, more mortgaged households are looking to secure social housing, adding even greater pressure to a flagging social housing sector.
Mortgage Arrears
At the end of Q2 of 2019, there were 81,232 home mortgages (private dwelling house (PDH) and buy-to-let (BTL)) in arrears, with 59,588 of these in arrears of more than 90 days, according to the Central Bank's Quarterly Mortgage Arrears and Repossessions Report. This represents a decrease on the previous year of 7.4 per cent of all mortgage accounts in arrears and 5.9 per cent of those in arrears of more than 90 days.
As of Q2 2019, a total of 108,874 home mortgages were in restructured arrangements (a decrease of 19.9 per cent on Q2 of 2018), with 32.7 per cent having had their arrears capitalised (that is, where the arrears are added to the outstanding balance of the mortgage and repayments recalculated based on this higher amount), 6.6 per cent on reduced payments, 18.7 per cent classified as ‘Other’ (which can include reduced repayment arrangements or temporary arrangements) and 20.6 per cent on ‘split mortgages’. Households with ‘split mortgages’ are most precarious where it is unlikely that they will experience a change in financial circumstances over the term of the loan and will therefore be dependent on realising the equity at the end of the warehoused period in order to pay the amount due. These families will then be faced with the prospect of selling their family home when they are at or close to retirement age.
At the end of Q2 of 2019, 2,367 residential properties were in possession of Central Bank lenders, including 1,407 PDHs, that is, where the mortgage was taken out in respect of the borrower’s own family home. Of the 257 family homes repossessed during this quarter, 14.4 per cent were on foot of a court order, with the remaining 86.6 per cent being voluntarily surrendered or abandoned.
Mortgage Arrears – Non-bank Entities
Non-bank entities held 118,464 family home mortgages, an increase of 92 per cent on all home mortgages (PDH and BTL) held by non-bank entities on the same period in 2018. Of these 118,464 home mortgages, 29 per cent are in arrears, with 24.4 per cent in arrears of more than 90 days.
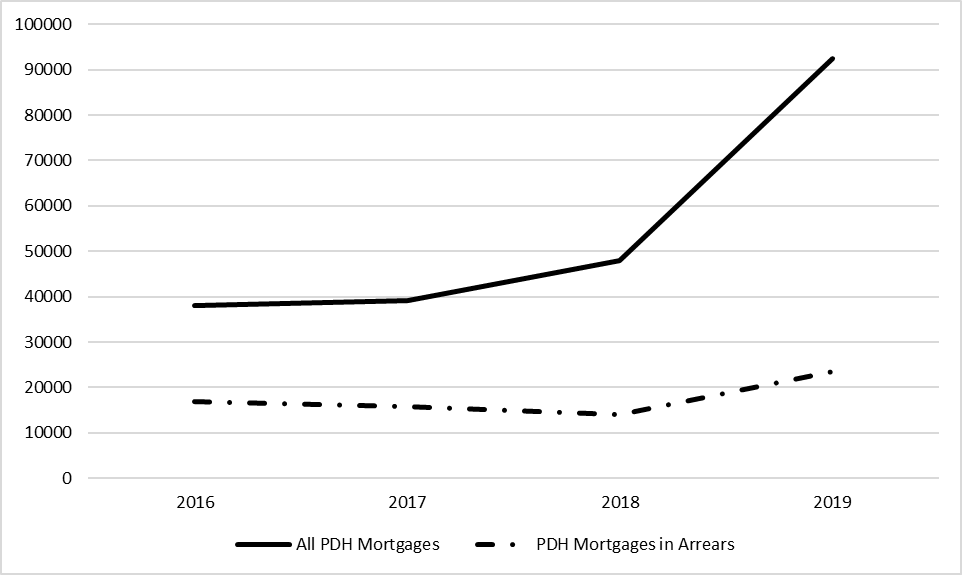
In recent years, mortgage banks have been selling mortgage loan books to non-bank entities as part of a strategy to reduce the number of non-performing loans (NPLs) to within EU parameters. Consumer advocates have expressed concerned about the lack of consumer protections for borrowers, particularly those whose loans were performing, while those in favour of this strategy cite the high level of NPLs acting as a barrier to accessing better credit terms, thereby contributing to Ireland’s high mortgage rates. Data extracted from the Central Bank’s quarterly statistical report on mortgage arrears show that while the number of PDH mortgages held by non-bank entities has risen by 143 per cent since 2016, the number in arrears was decreasing between 2016 and 2018, before increasing sharply in 2019 (Chart 1).
Chart 1: PDH Mortgages held and Mortgage Arrears, Non-Bank Entities, 2016 to 2019

Source: Central Bank of Ireland, Residential Mortgage Arrears and Repossession Statistics, various years
Note: Data for end Q2 each year.
Mortgage Arrears – Local Authorities
Of the 15,337 local authority mortgages active as of Q2 2019, 41 per cent were in arrears, representing 6,330 low-income households, 3,101 of which are in arrears of more than 90 days (Department of Housing, Planning and Local Government, 2019). This represents a reduction of 533 mortgages in arrears and 470 mortgages in arrears of more than 90 days when compared to the same period in 2018. During this period there were also 202 fewer mortgages recorded in total.
The latest local authority repossession figures show 20 forced (an increase of 82 per cent on 2017) and 12 voluntary repossessions (a decrease of 54 per cent on 2017) took place in 2018 according to data from the Department of Housing, Planning and Local Government. The only option for these families is adequate social housing, which this and previous Governments have failed to provide. This social housing could be provided by the expansion of a Local Authority Mortgage to Rent Scheme, piloted in 2013 and rolled out in subsequent years. There were 65 Local Authority Mortgage to Rent transactions completed in 2018, a decrease of 28 per cent on the previous year.