The tax and benefit impacts of this Government's 4 Budgets

Budget 2020 marks the fourth Budget of the current Government. Below, we track the cumulative impact of changes to income taxation and welfare over the Government’s four Budgets.
At the outset it is important to stress that our analysis does not take account of other budgetary changes, most particularly to indirect taxes (VAT and excise), other charges (such as prescription charges) and property taxes. Similarly, it does not capture the impact of changes to the provision of public services. As the impact of these measures differs between households it is impossible to quantify precise household impacts and include them here. However, as we have demonstrated in previous editions of our Budget Analysis and Critique, these changes impact hardest on households with the lowest incomes.
The households we examine are spread across all areas of society and capture those with a job, families with children (under 12 years), those unemployed and pensioner households. Within those households that have income from a job, we include workers on the minimum wage, on the living wage, workers on average earnings and multiples of this benchmark, and families with incomes ranging from €25,000 to €200,000.
In the case of working households, the analysis is focused on PAYE earners only and therefore does not capture the changes in recent Budgets targeted at the self-employed.
Over the years examined all household types record an increase in disposable income.
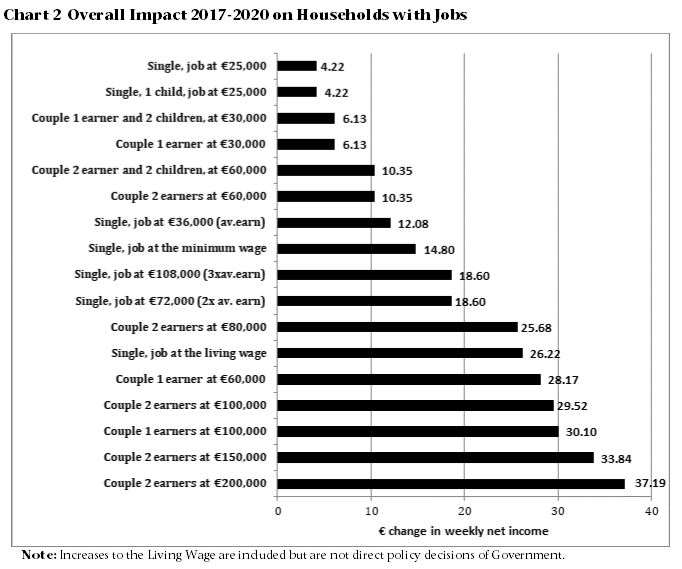
Among households with jobs (see chart 2), the gains experienced range from €4.22 per week (for single workers on €25,000) to almost nine times as much, €37.19 per week, for a couple with 2 earners on €200,000. Overall, across these households the main gains have flowed to those on the highest incomes.
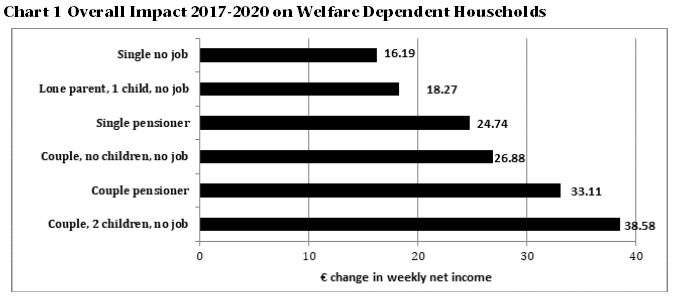
Among households dependent on welfare, the gains have ranged from €16.19 per week (to single unemployed individuals) to €38.58 per week to unemployed couples with two children - see chart 8.1.
Our analysis points towards the choices and priorities the Government has made. Overall these choices have given least to single welfare-dependent households and those on the lowest earnings.