Ireland’s Tax-Take: How We Compare in 2023

The experience of the past two decades has highlighted the central role of taxation in budget deliberations and in shaping policy at both macro and micro level. Taxation not only funds public services, but also supports economic activity and redistributes resources to build a fairer society - making it essential to be clear about both our objectives and the tools to achieve them.
Against this backdrop, the most recent comparative data on Ireland’s total tax-take, produced by Eurostat for 2023, places us alongside 26 other EU states in Table 1.
| Table 1: | Total Tax Revenue as a % of GDP for EU-27 Countries, 2023 | ||||||
|---|---|---|---|---|---|---|---|
| Country | % of GDP | +/- from average | Country | % of GDP | +/- from average | ||
| France | 45.6 | 8.5 | Slovenia | 36.9 | -0.2 | ||
| Belgium | 44.8 | 7.7 | Poland | 36.0 | -1.1 | ||
| Denmark | 44.1 | 7.0 | Slovakia | 35.5 | -1.6 | ||
| Austria | 43.5 | 6.4 | Hungary | 35.1 | -2.0 | ||
| Luxembourg | 42.8 | 5.7 | Czechia | 34.1 | -3.0 | ||
| Finland | 42.7 | 5.6 | Estonia | 34.0 | -3.1 | ||
| Sweden | 42.1 | 5.0 | Latvia | 33.4 | -3.7 | ||
| Italy | 41.7 | 4.6 | Lithuania | 32.4 | -4.7 | ||
| Greece | 40.7 | 3.6 | Ireland GNDI | 30.0 | -7.1 | ||
| Germany | 40.3 | 3.2 | Bulgaria | 29.9 | -7.2 | ||
| Netherlands | 39.1 | 2.0 | Ireland GNP | 29.6 | -7.5 | ||
| Cyprus | 38.8 | 1.7 | Malta | 27.1 | -10.0 | ||
| Portugal | 37.6 | 0.5 | Romania | 27.0 | -10.1 | ||
| Croatia | 37.3 | 0.2 | Ireland GDP | 22.5 | -14.6 | ||
| Spain | 37.0 | -0.1 | EU-27 average | 37.1 | |||
| Source: | Eurostat online database and CSO online database: National Income and Expenditure Accounts (as per Table 4.1). | ||||||
| Notes: | EU-27 average is the arithmetic mean. As Ireland’s figures have been skewed by large multinational effects in national accounts and taxation income we use three national income measures. | ||||||
The definition of taxation employed by Eurostat comprises all compulsory payments to central government (direct and indirect) alongside social security contributions (employee and employer) and the tax receipts of local authorities.[1]The tax-take of each country is established by calculating the ratio of total taxation revenue to national income as measured by gross domestic product (GDP). Table 1 also compares the tax-take of all EU member states against the average EU-27 tax-take of 37.1 per cent.
Of the EU-27 states, the highest tax ratios can be found in France, Belgium, Denmark, Austria, Luxembourg, Finland, Sweden and Italy and while the lowest appear in Romania, Malta, Bulgaria, Lithuania, Latvia and Ireland. The effect of multinational company restructuring on Ireland’s national accounts from 2015, and subsequent short-term corporate tax excess revenue increases, impacts on the data by inflating Ireland’s GDP (and GNP) figure. Prior to this effect, Ireland’s tax to GDP ratio stood at around 30.5 per cent; some way below the EU average.
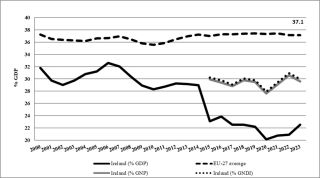
Ireland’s overall tax take has remained notably below the EU average over recent years (see chart 1). The increase in the overall level of taxation between 2002 and 2006 can be explained by short-term increases in construction-related taxation sources (in particular stamp duty and construction related VAT) rather than any underlying structural increase in taxation levels. Similarly, the increase from 2020 to 2022 is principally associated with the windfall corporate tax revenues.
Chart 1: Trends in Ireland and EU-27 Overall Taxation Levels, 2000-2023
In the context of the figures in table 1, and the trends in chart 1, the question needs to be asked: if we continue to expect our economic and social infrastructure to catch up to that in the rest of Europe, how can we do this while simultaneously gathering less taxation income than it takes to run the infrastructure already in place in most of those other European countries? In reality, we will never bridge the social and economic infrastructure gaps unless we sustainably gather a larger share of our national income and invest it in building a fairer and more successful Ireland.
How much should Ireland collect in taxation?
Social Justice Ireland believes that, over the period ahead, policy should focus on increasing Ireland’s tax-take to support essential public services and infrastructure. We propose a new tax-take target of €15,000 per capita in 2017 terms, increasing annually in line with nominal GNI*. This translates to approximately €28,200 per capita in 2026, requiring an additional €30 billion per annum in stable, recurring tax revenueto be raised excluding windfall gains. Our target is calculated using CSO population data, ESRI population projections, and CSO and Department of Finance data on recent and future nominal overall taxation levels. Achieving this would align Ireland with European standards while providing sustainable resources for public investment, fostering economic growth, and improving living standards for all.
Increasing the overall tax take to this level would require a number of changes to the tax base and the current structure of the Irish taxation system, as outlined in detail in our 2025 socio-economic review and in Budget Choices 2026 to initiate this process. Gradually increasing the overall taxation revenue to meet this new target would represent a small overall increase in per capita taxation levels and one that is unlikely to have any significant negative impact on the economy. As a policy objective, Ireland can remain a low-tax economy, but it should not be incapable of adequately supporting the economic, social, and infrastructural requirements necessary to support our society and complete our convergence with the rest of Europe.
[1] See European Commission (2014:268-269) for a more comprehensive explanation of this classification.